Everything it measures.
Every screenshot on this page is the running product, captured against a synthetic six-developer database. Nothing here is a mockup and nothing here is anyone's real data.
01 Money
What the last thirty days cost.
Tokens, sessions, events and tool calls for whatever window you pick: 24 hours, 7 days, 30, 90, all time, or a custom range that every panel on the page respects at once.
The headline figure is notional: your tokens priced against the public API rate card. On a flat-rate subscription there is no bill to shrink, so read it as what this work would have cost on the meter.


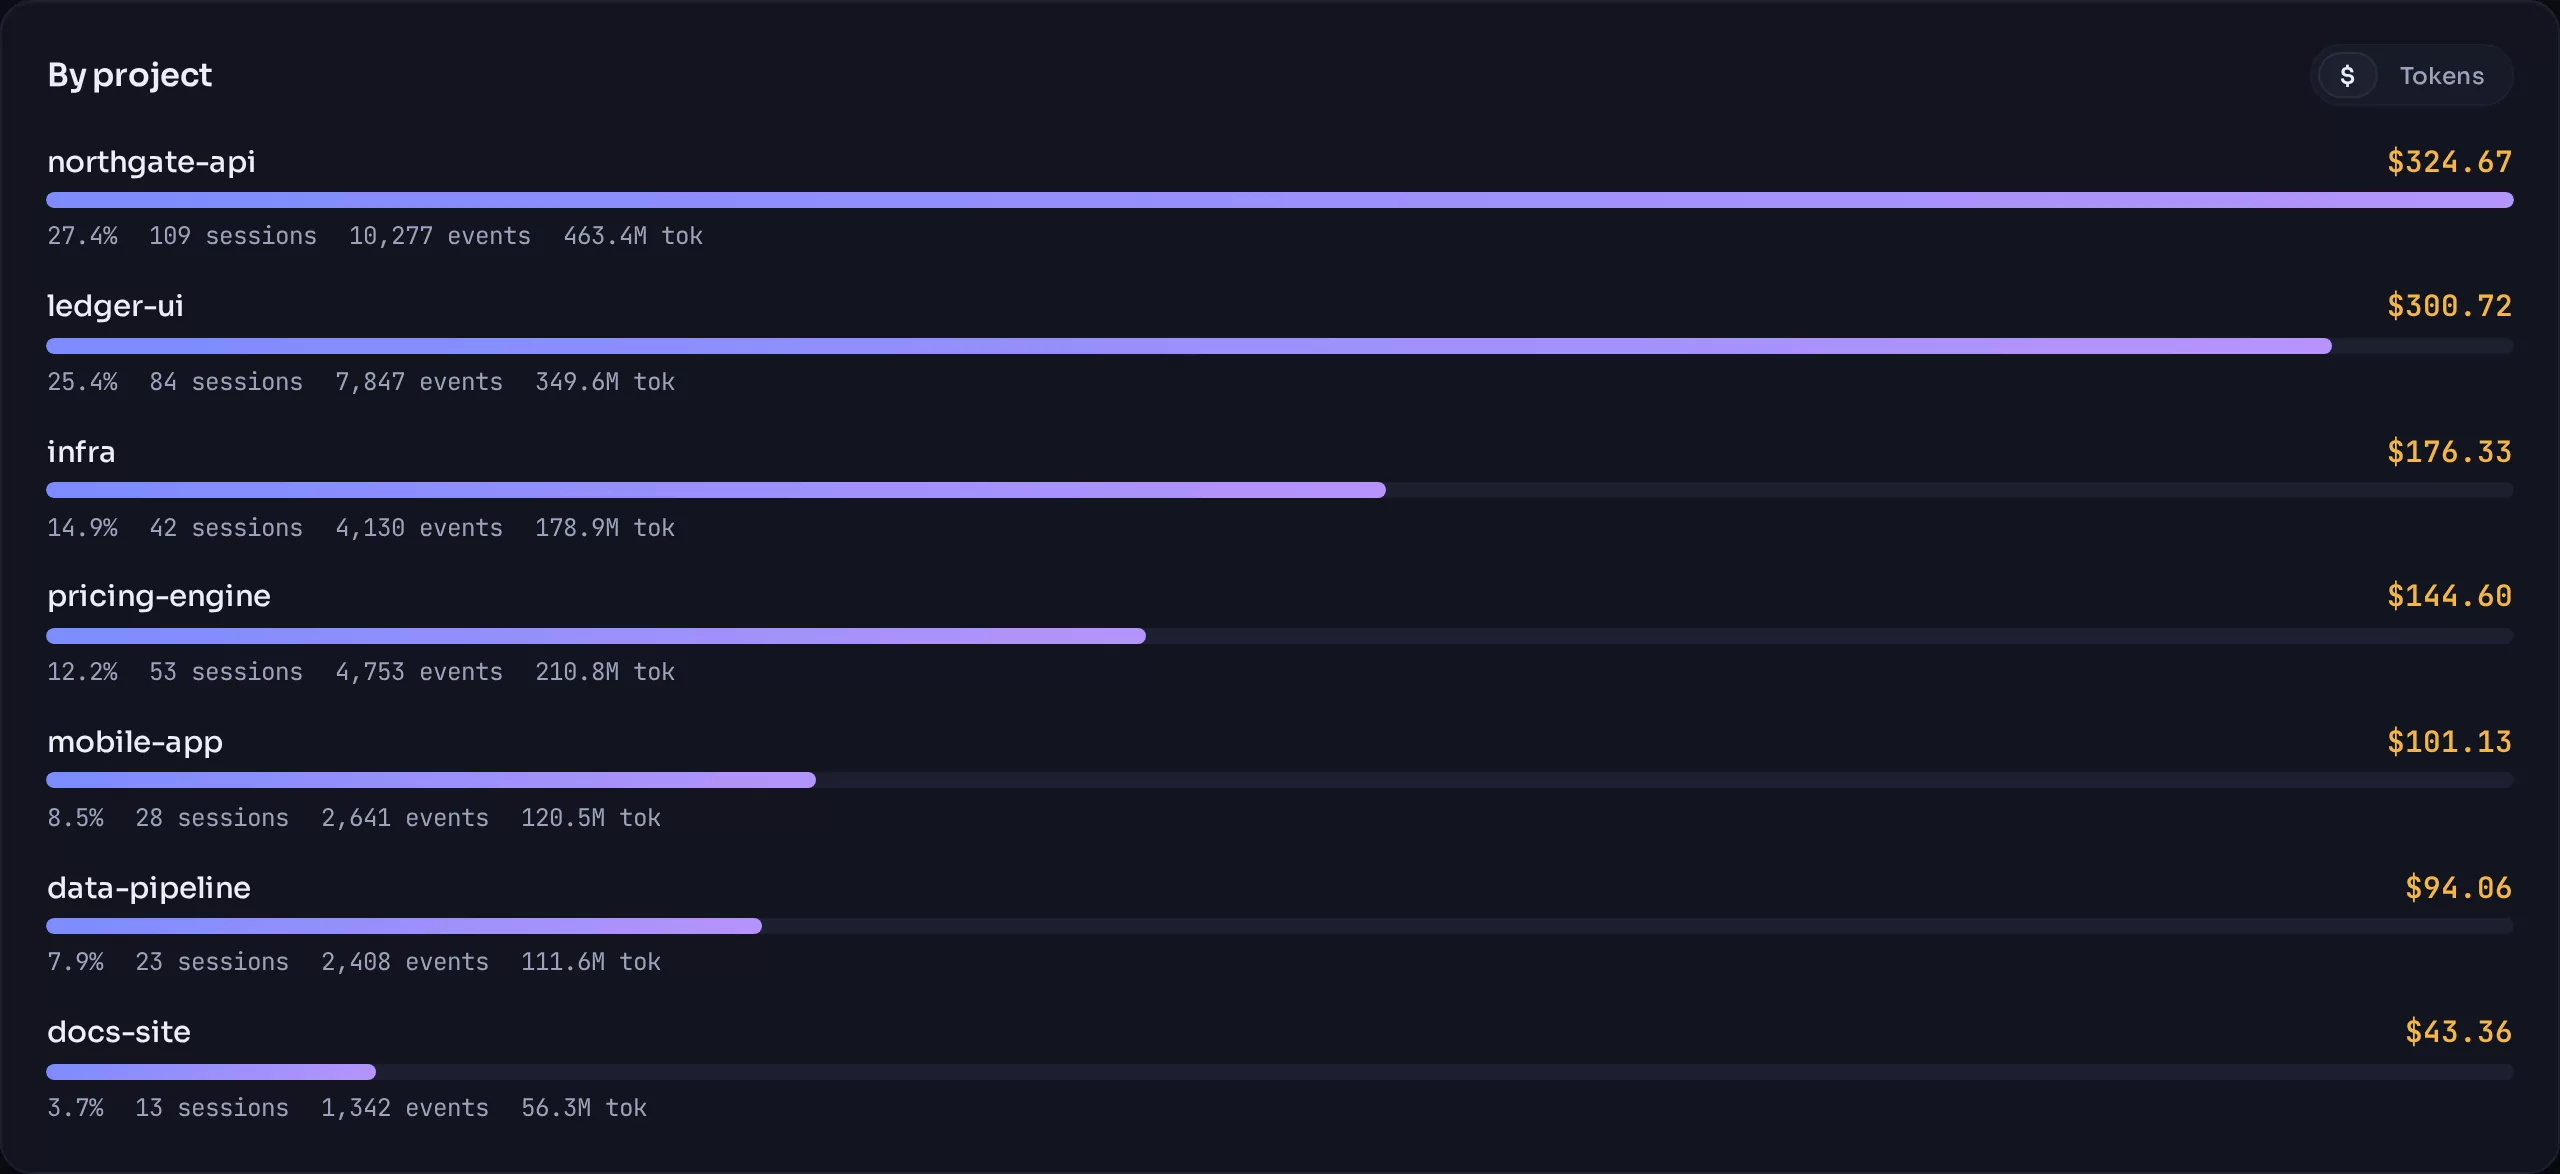
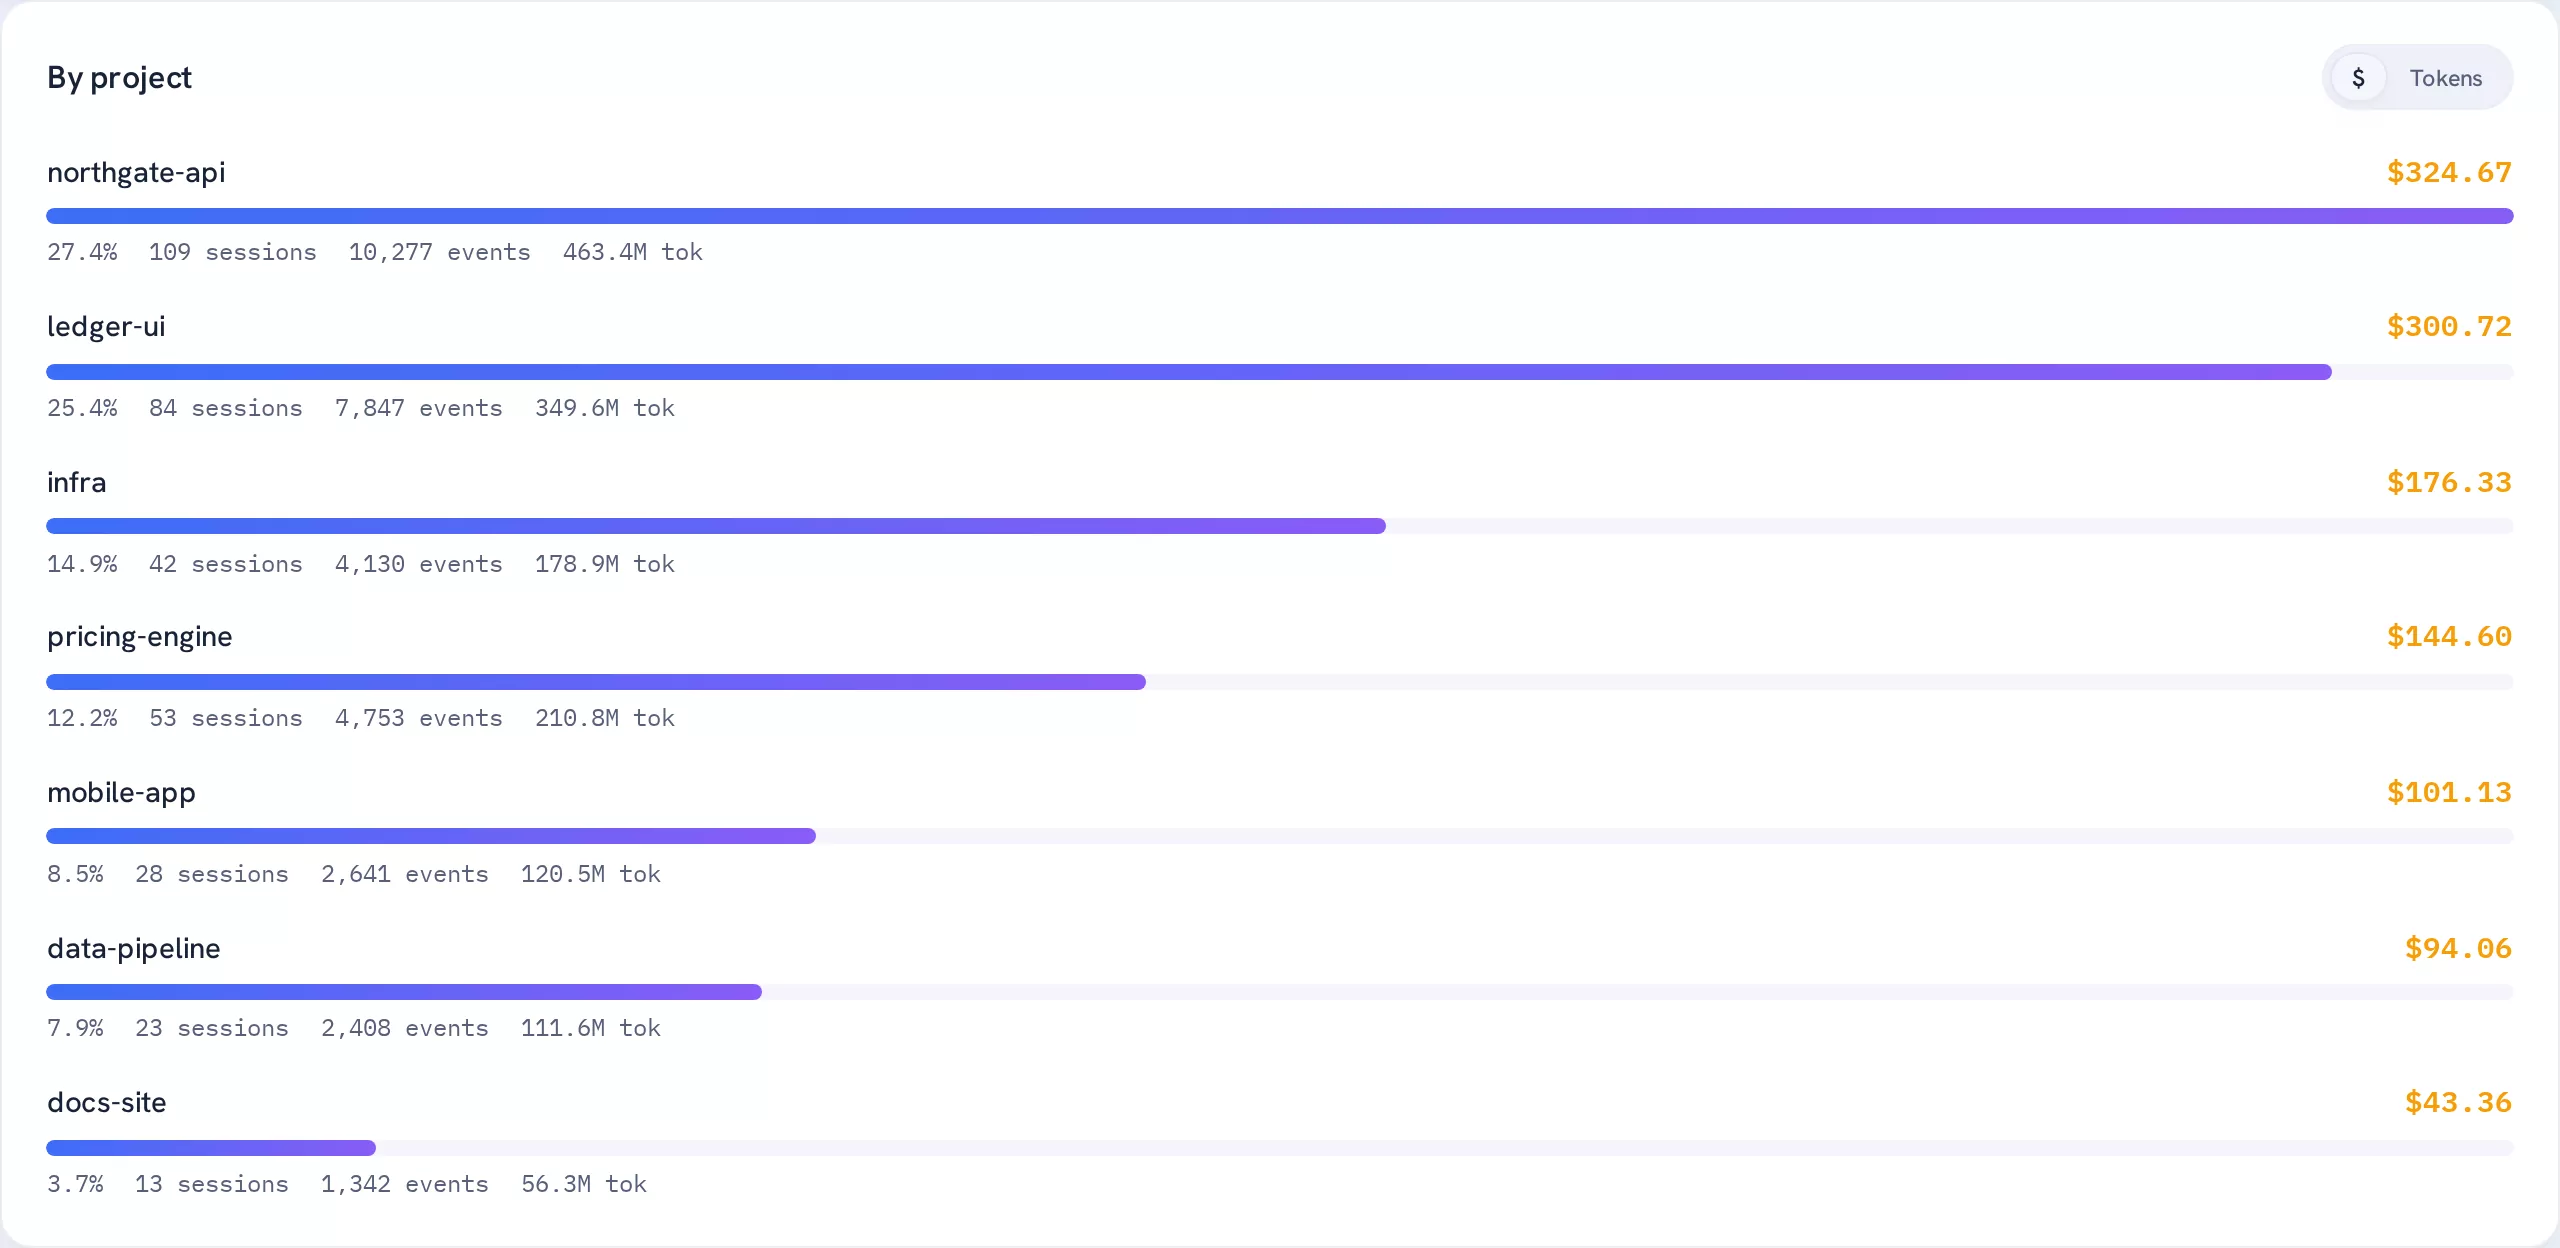
Cost by project, ranked.
Every session carries the directory it ran in, so spend attributes to a repository without anyone tagging anything. The bar is share of cost; the line under it is the sessions, events and tokens that produced it.
Beyond the top twelve, the remainder folds into a single "other" row rather than a tail of noise.
The expensive model is rarely the busy one.
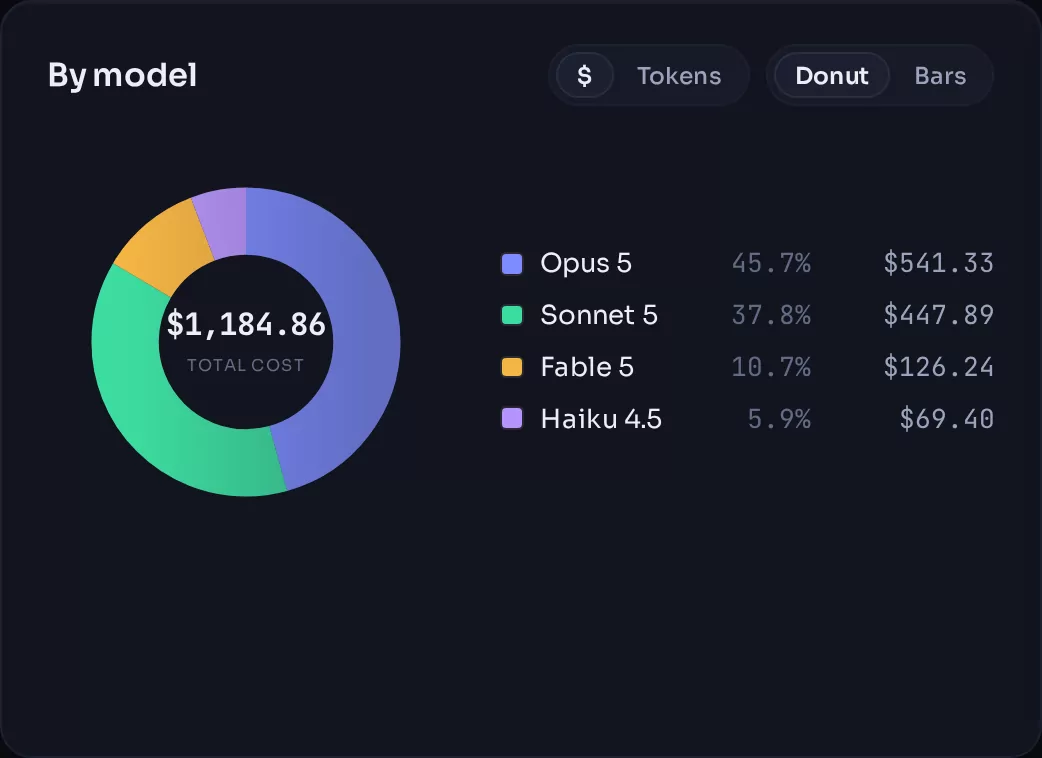
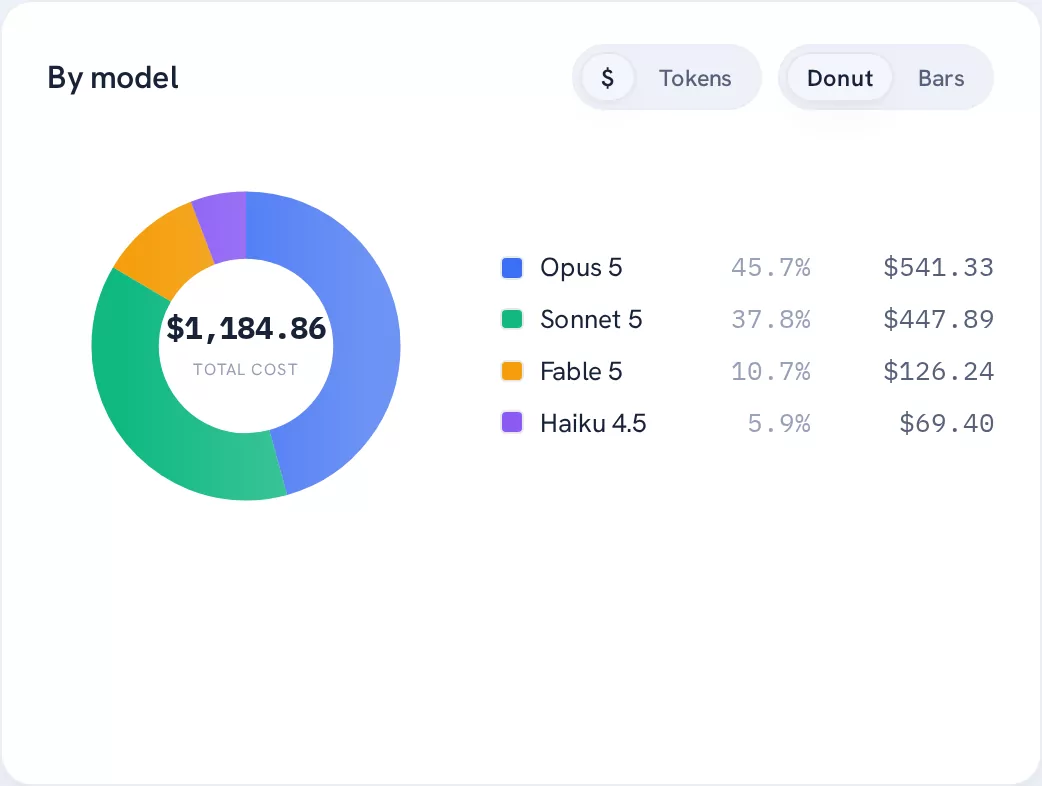
Split by cost or by tokens, as a donut or as bars. Opus doing a third of the turns and two thirds of the spend is the normal shape, and it is the first thing worth knowing.
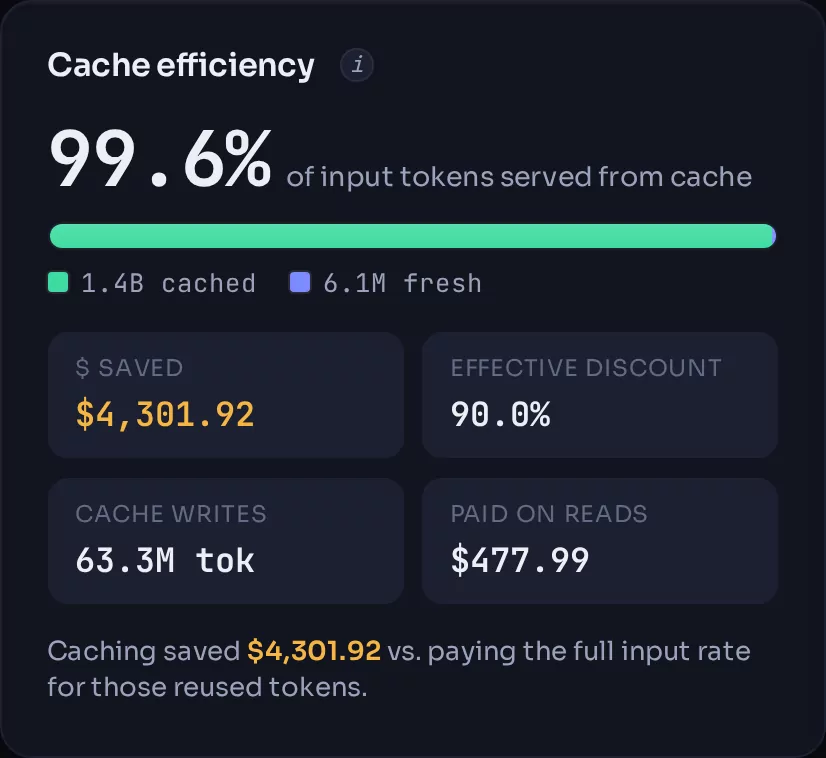
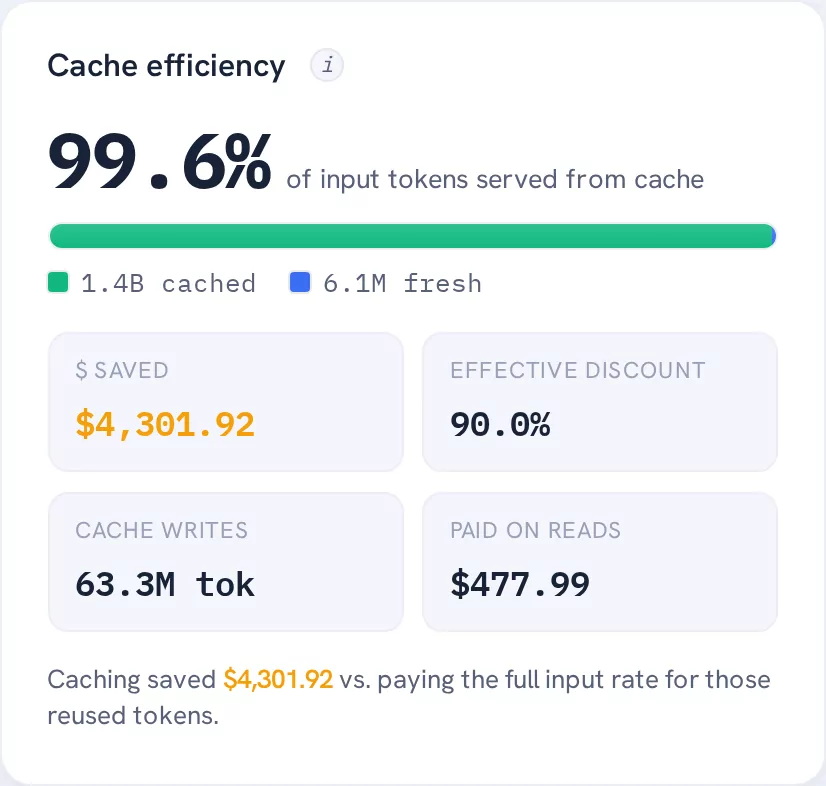
Cache efficiency, which almost nobody measures.
Prompt caching means most of what a long session re-reads costs a tenth of fresh input. The panel shows the ratio, what it saved, and the effective discount, so a change in how your team prompts shows up as a number rather than a feeling.
Shape, not just totals.
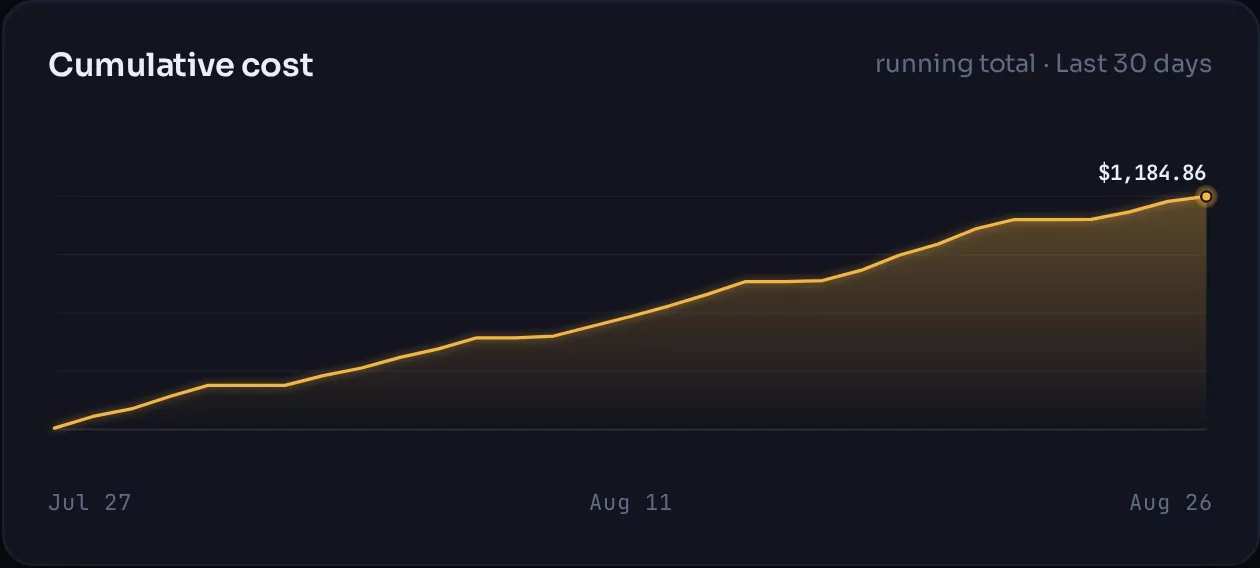
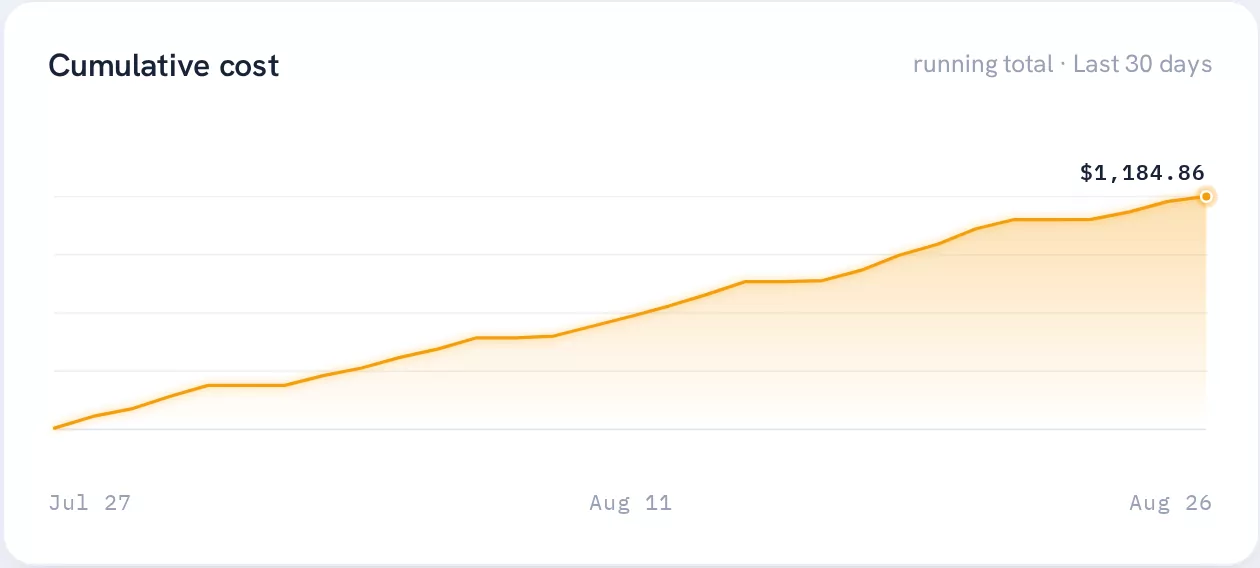
Usage bucketed by hour or day with the four token classes stacked, a per-model series, and a cumulative curve that makes a step change obvious the week it happens rather than the month the invoice arrives.
02 Waste
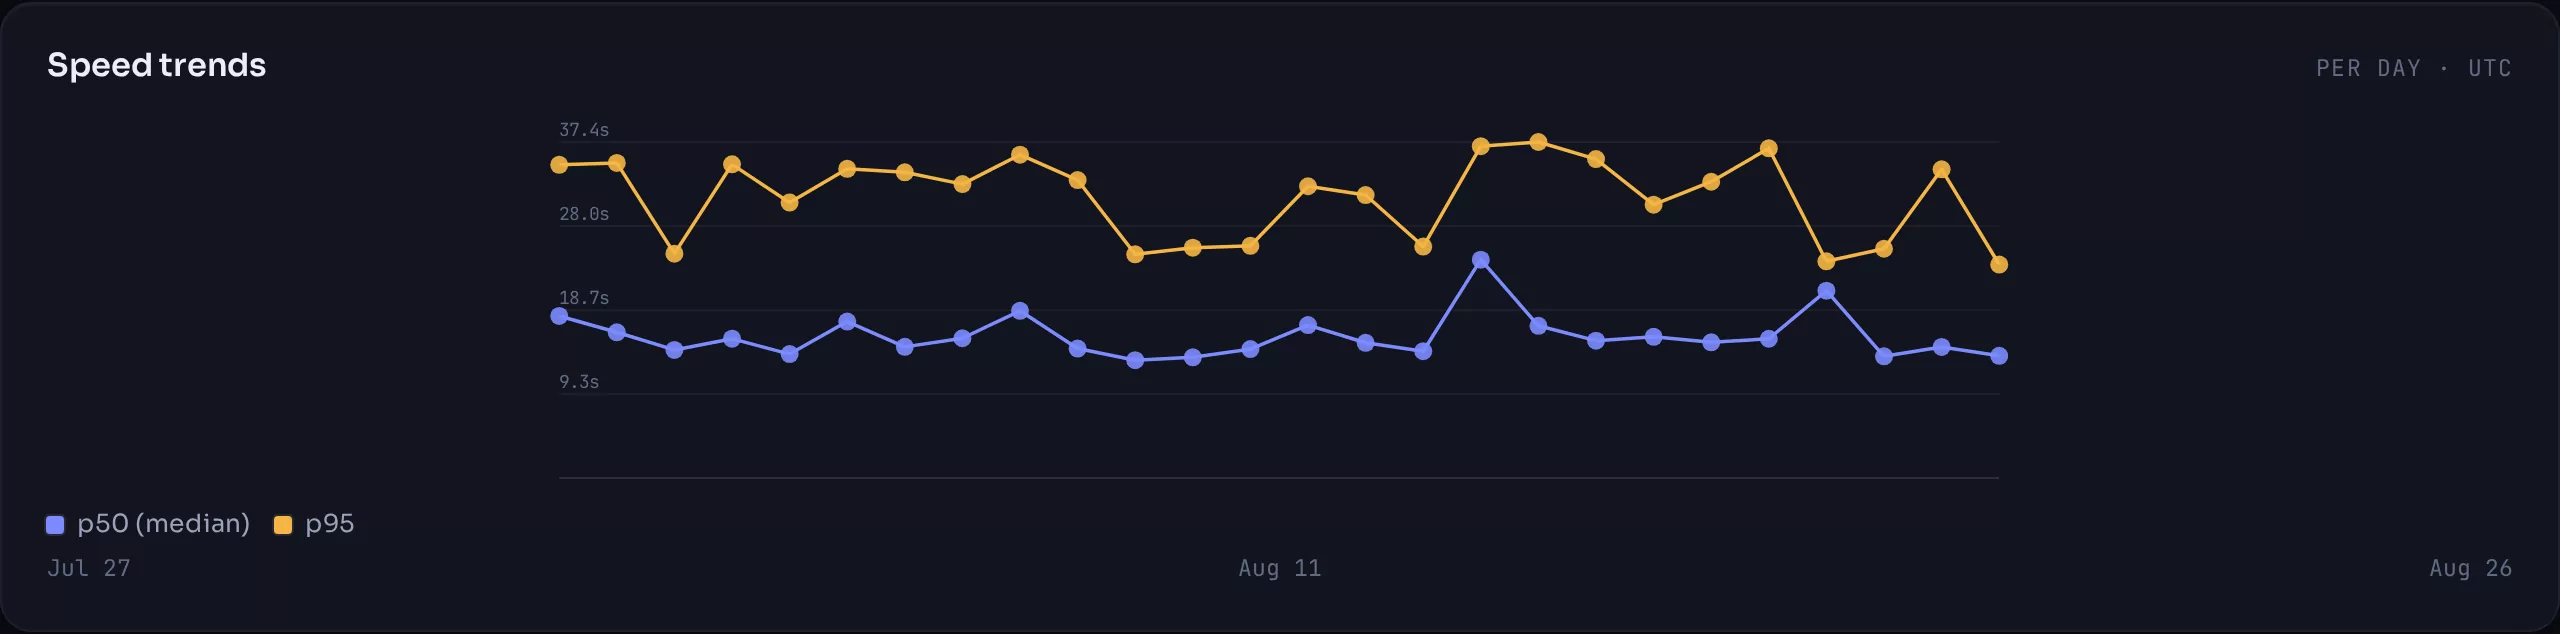
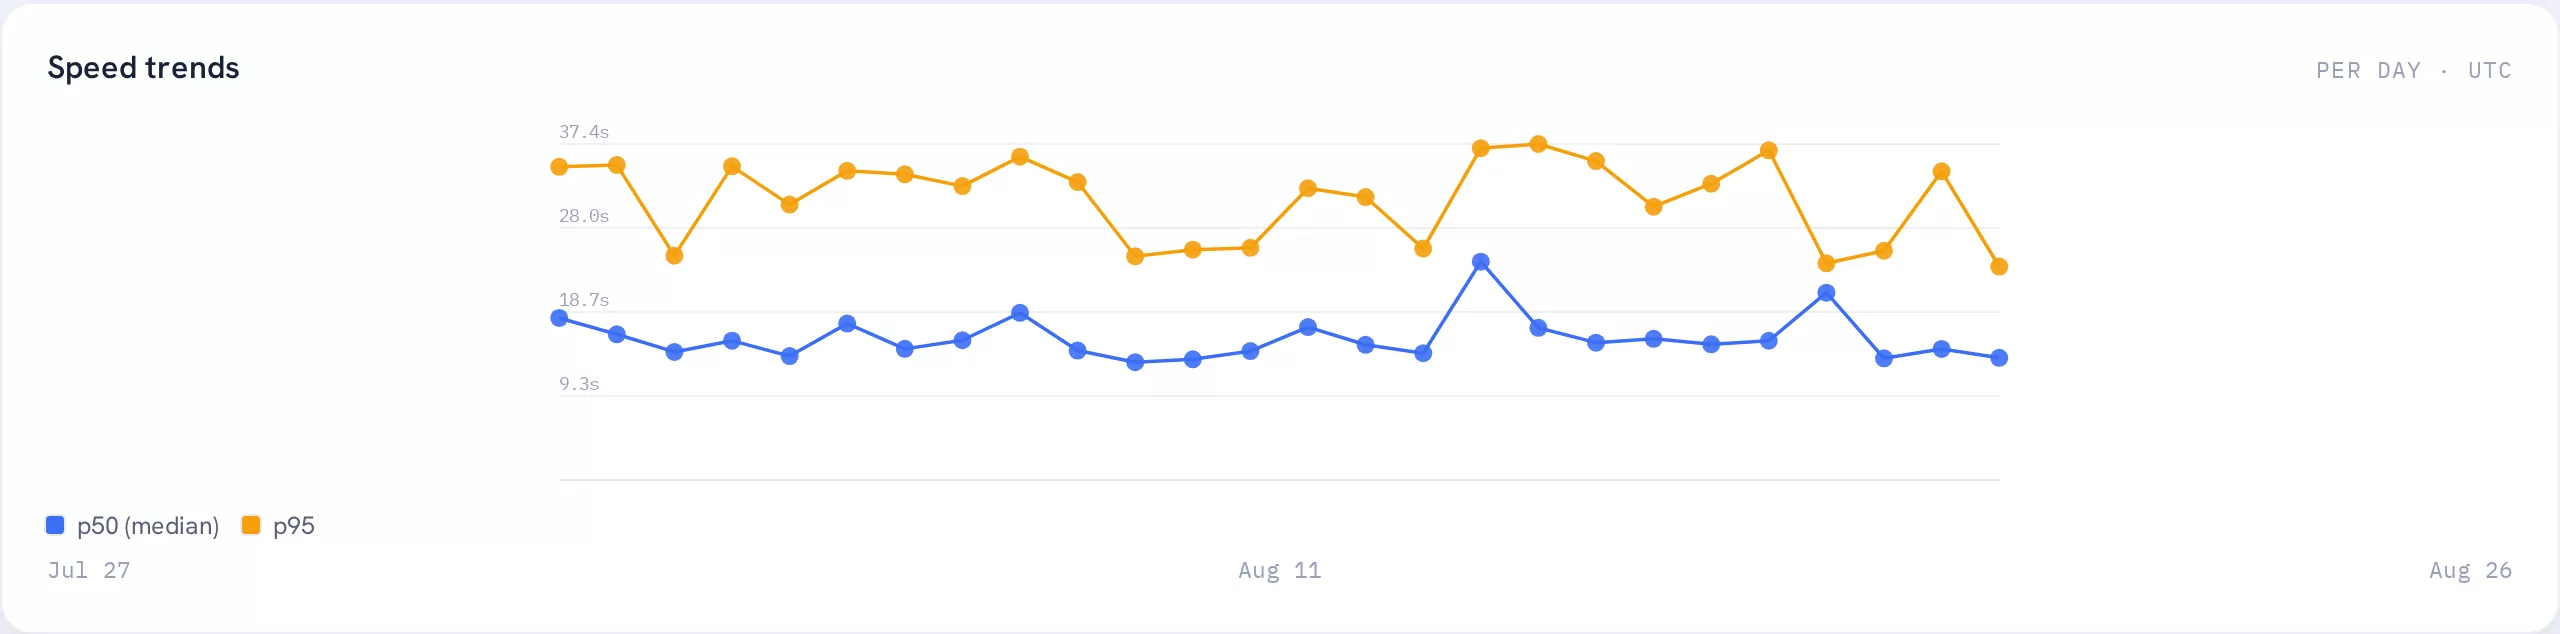
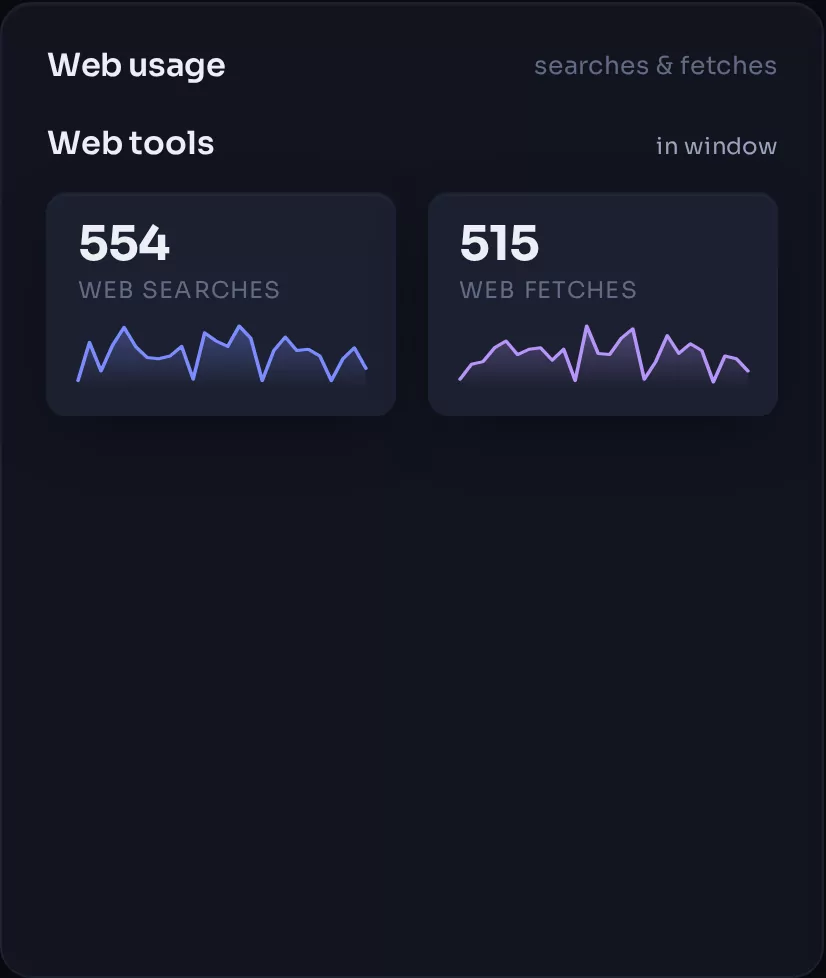
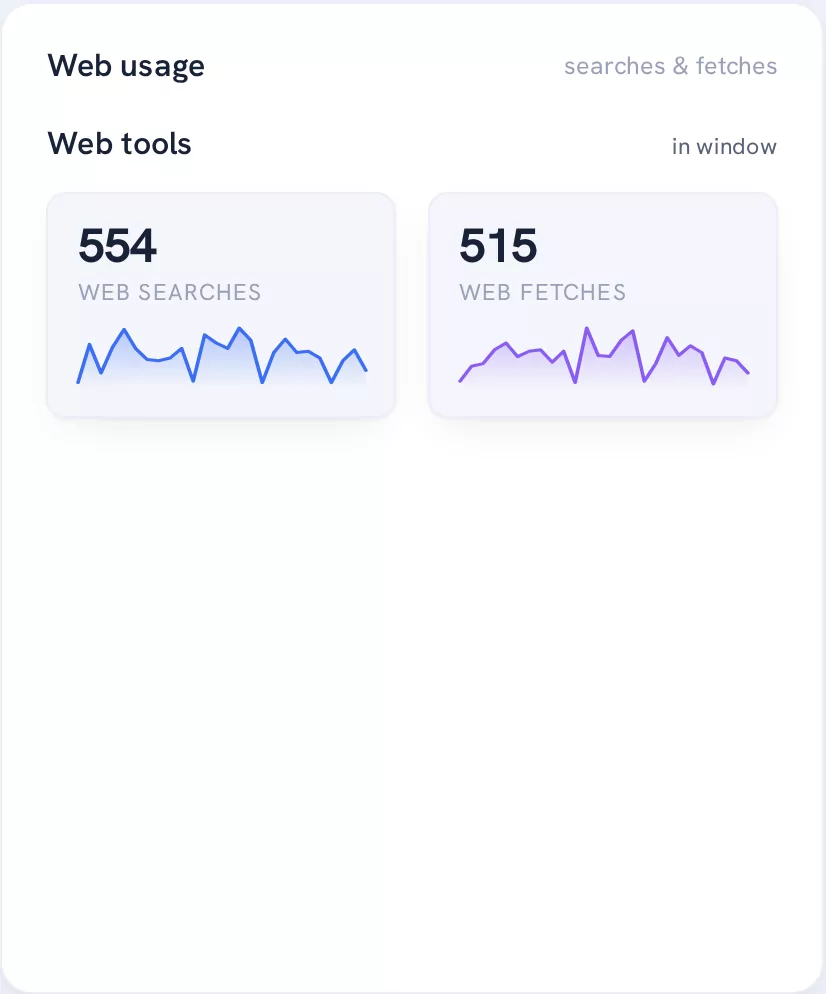
Tokens you paid for and threw away.
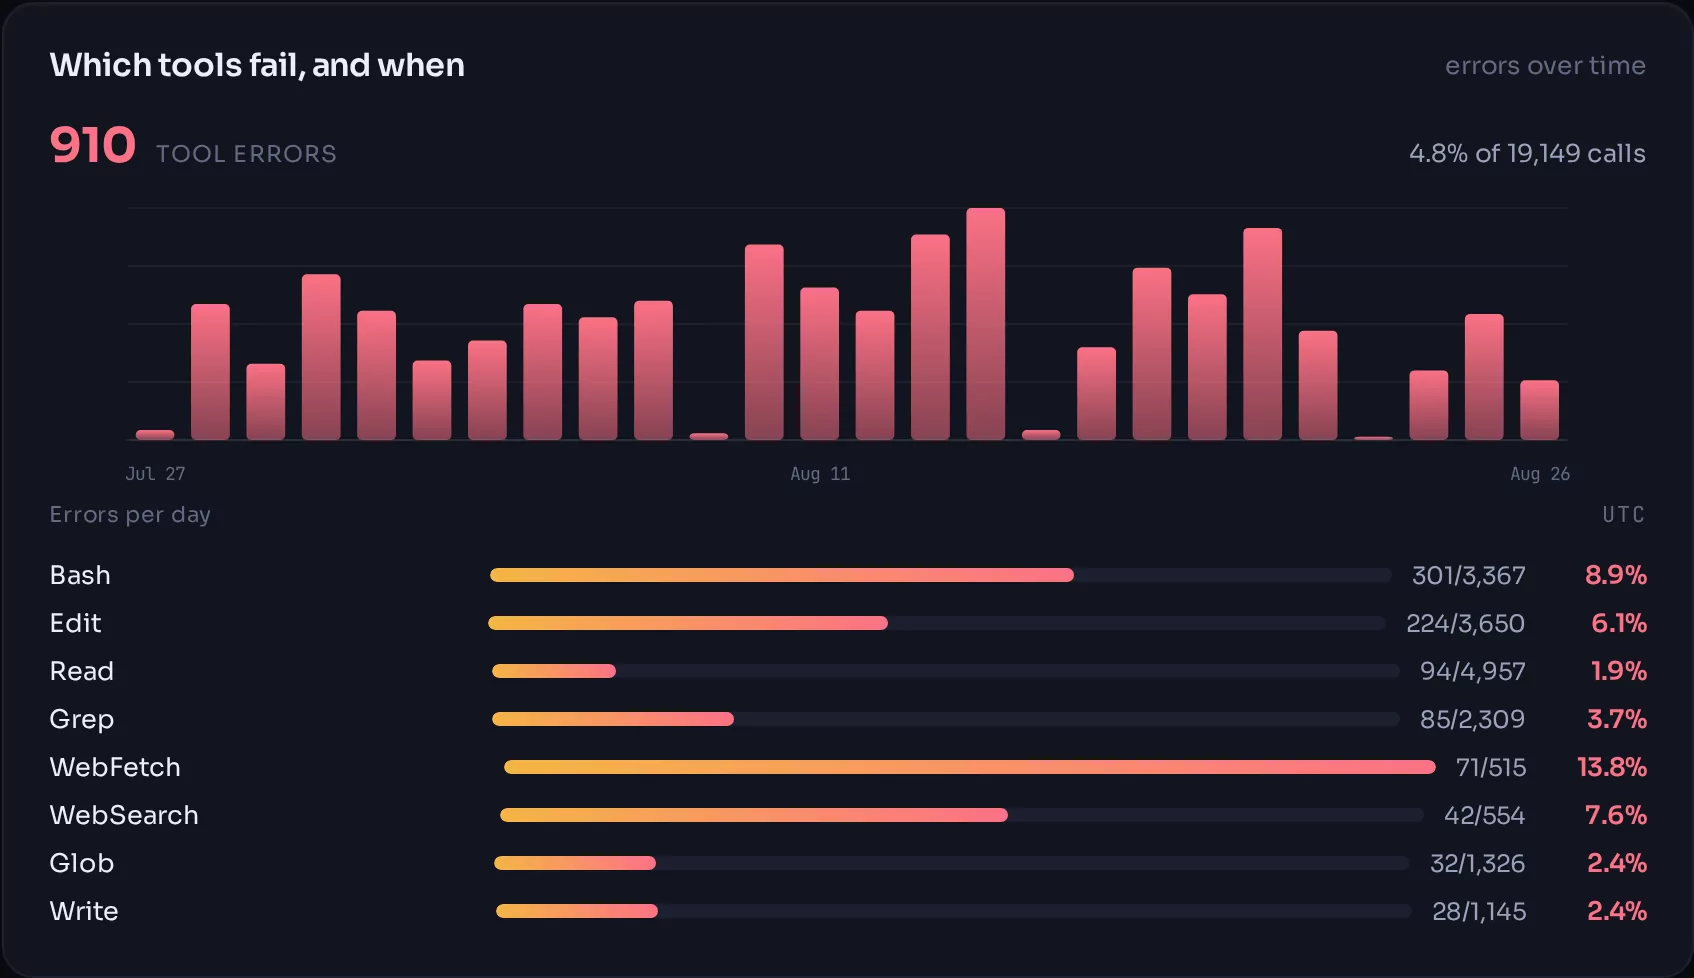
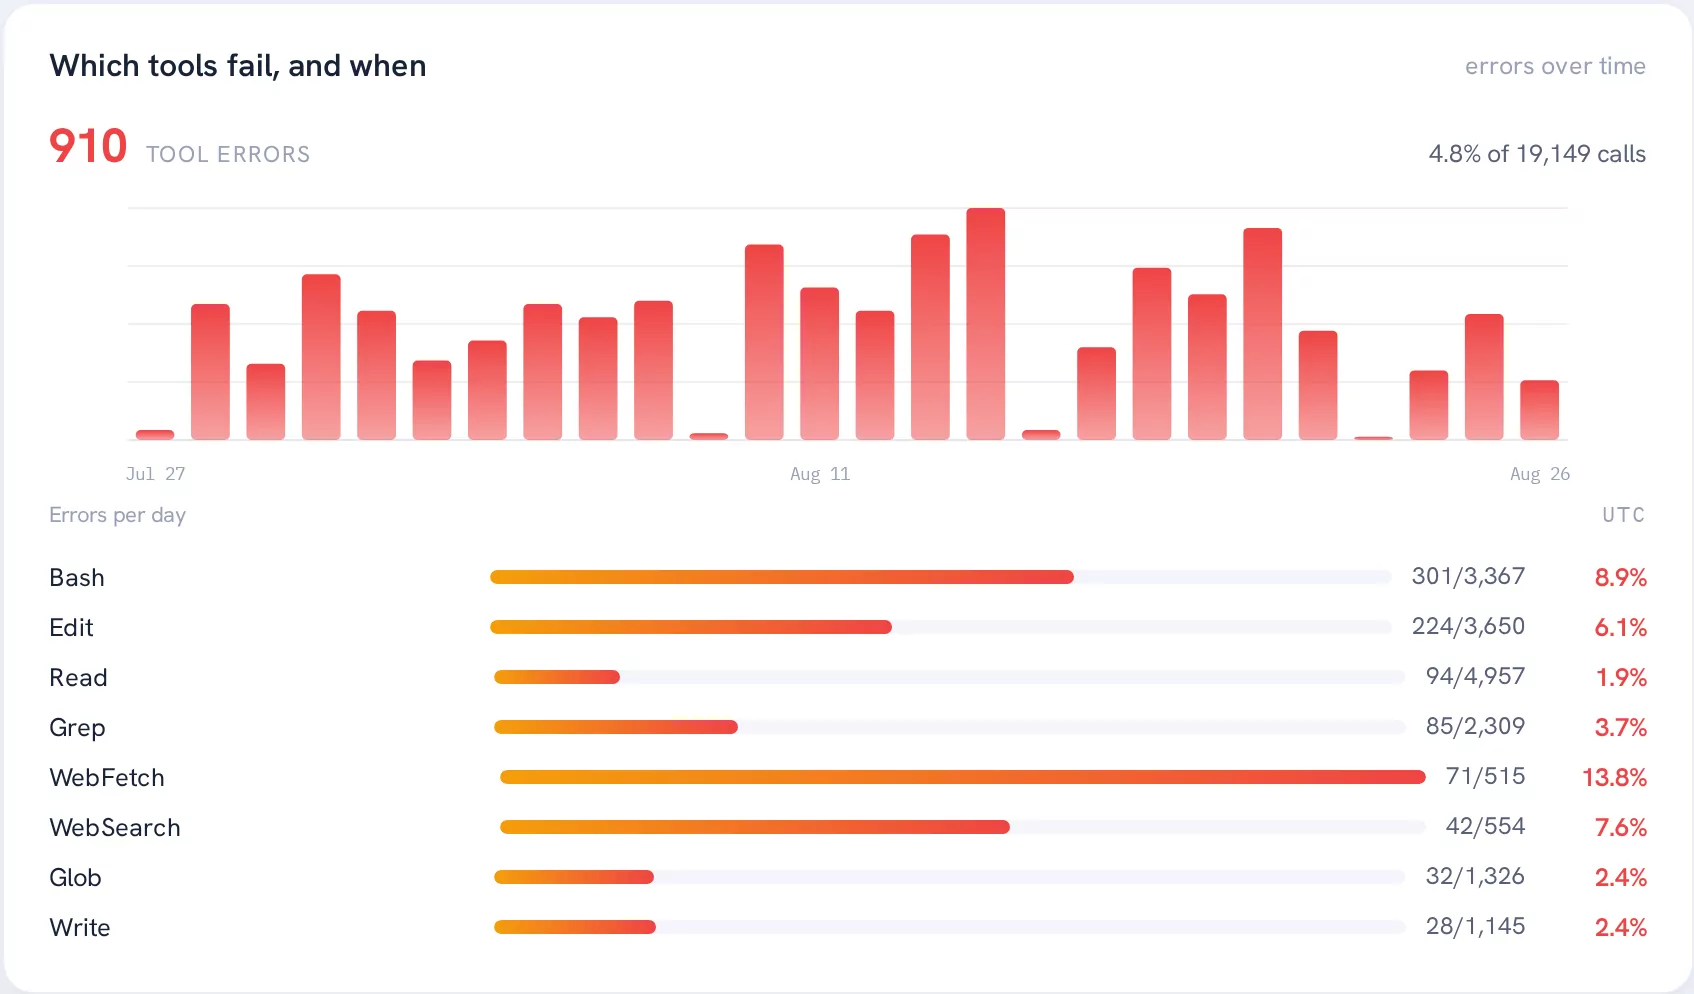
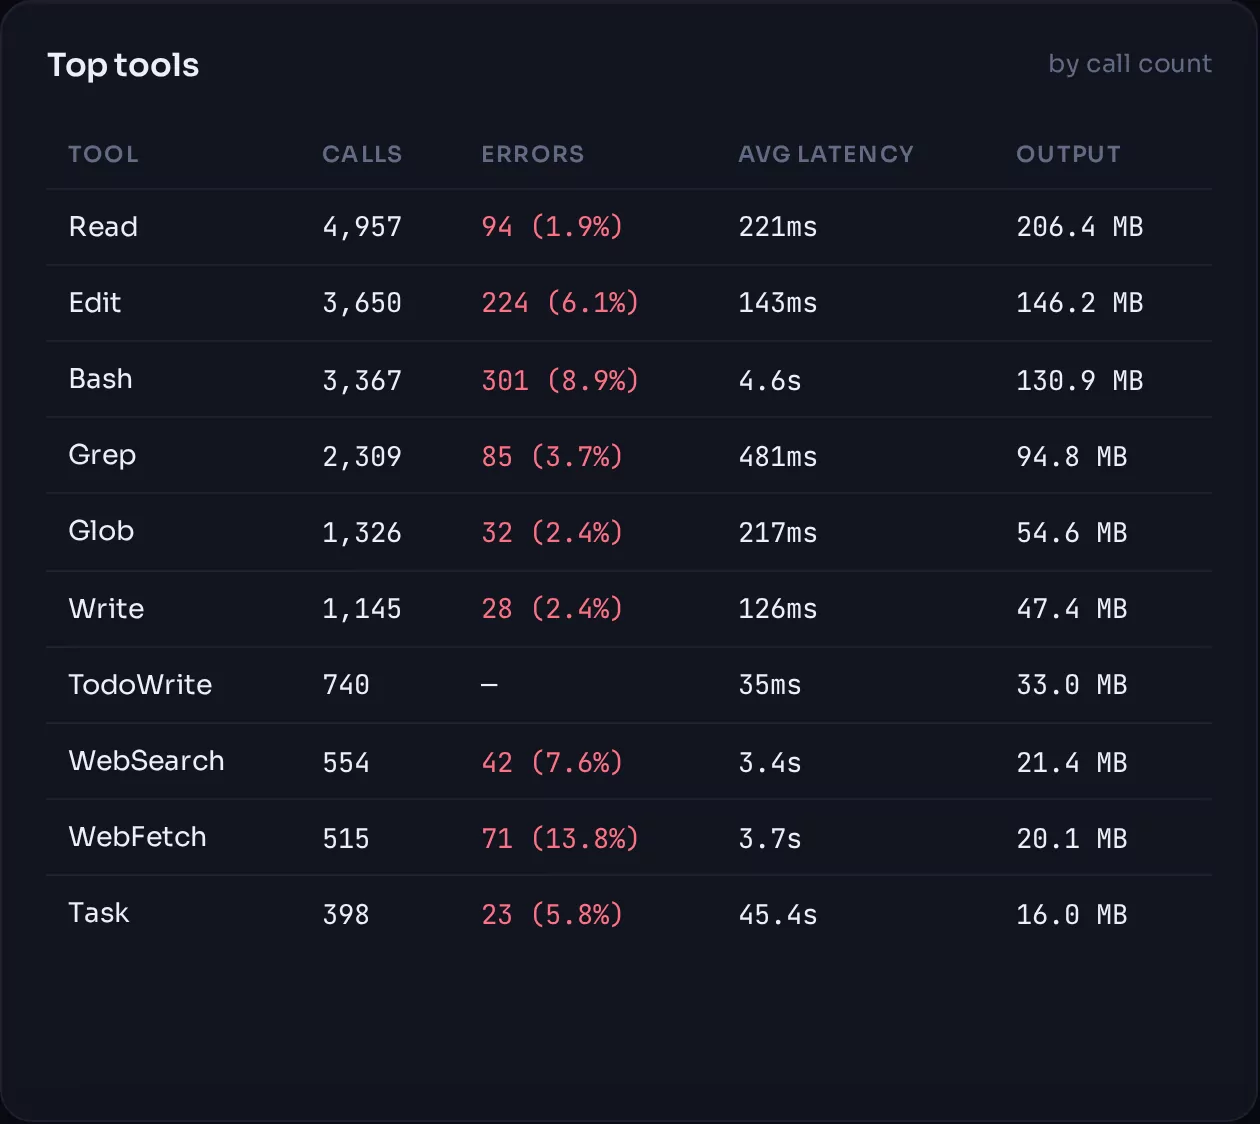
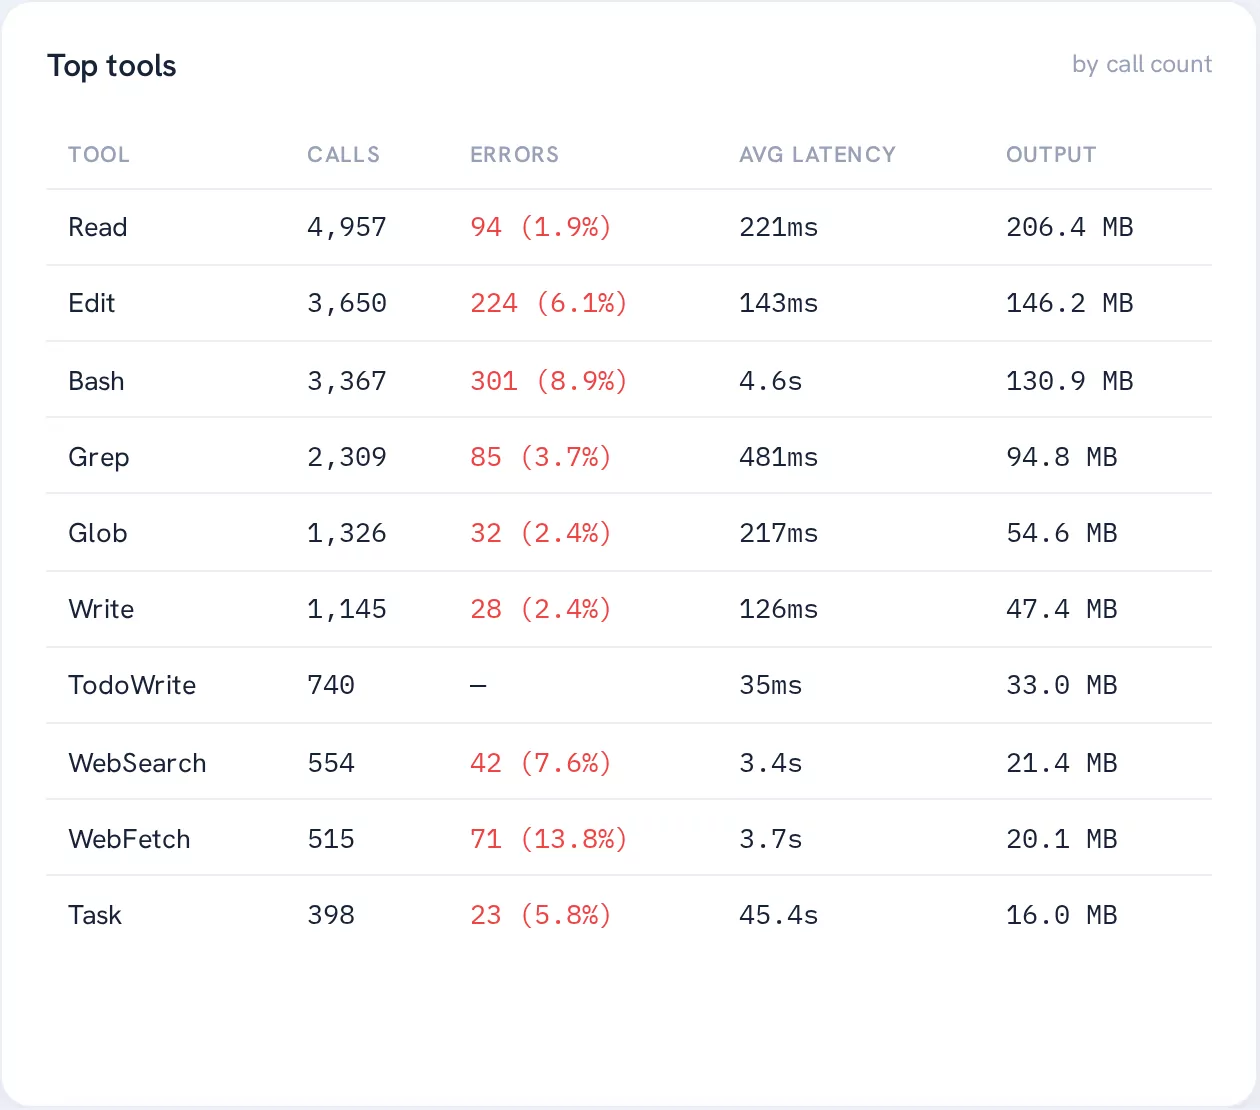
A failed tool call still cost you the turn that produced it. These are the panels that find the spend with nothing to show for it.
03 Limits
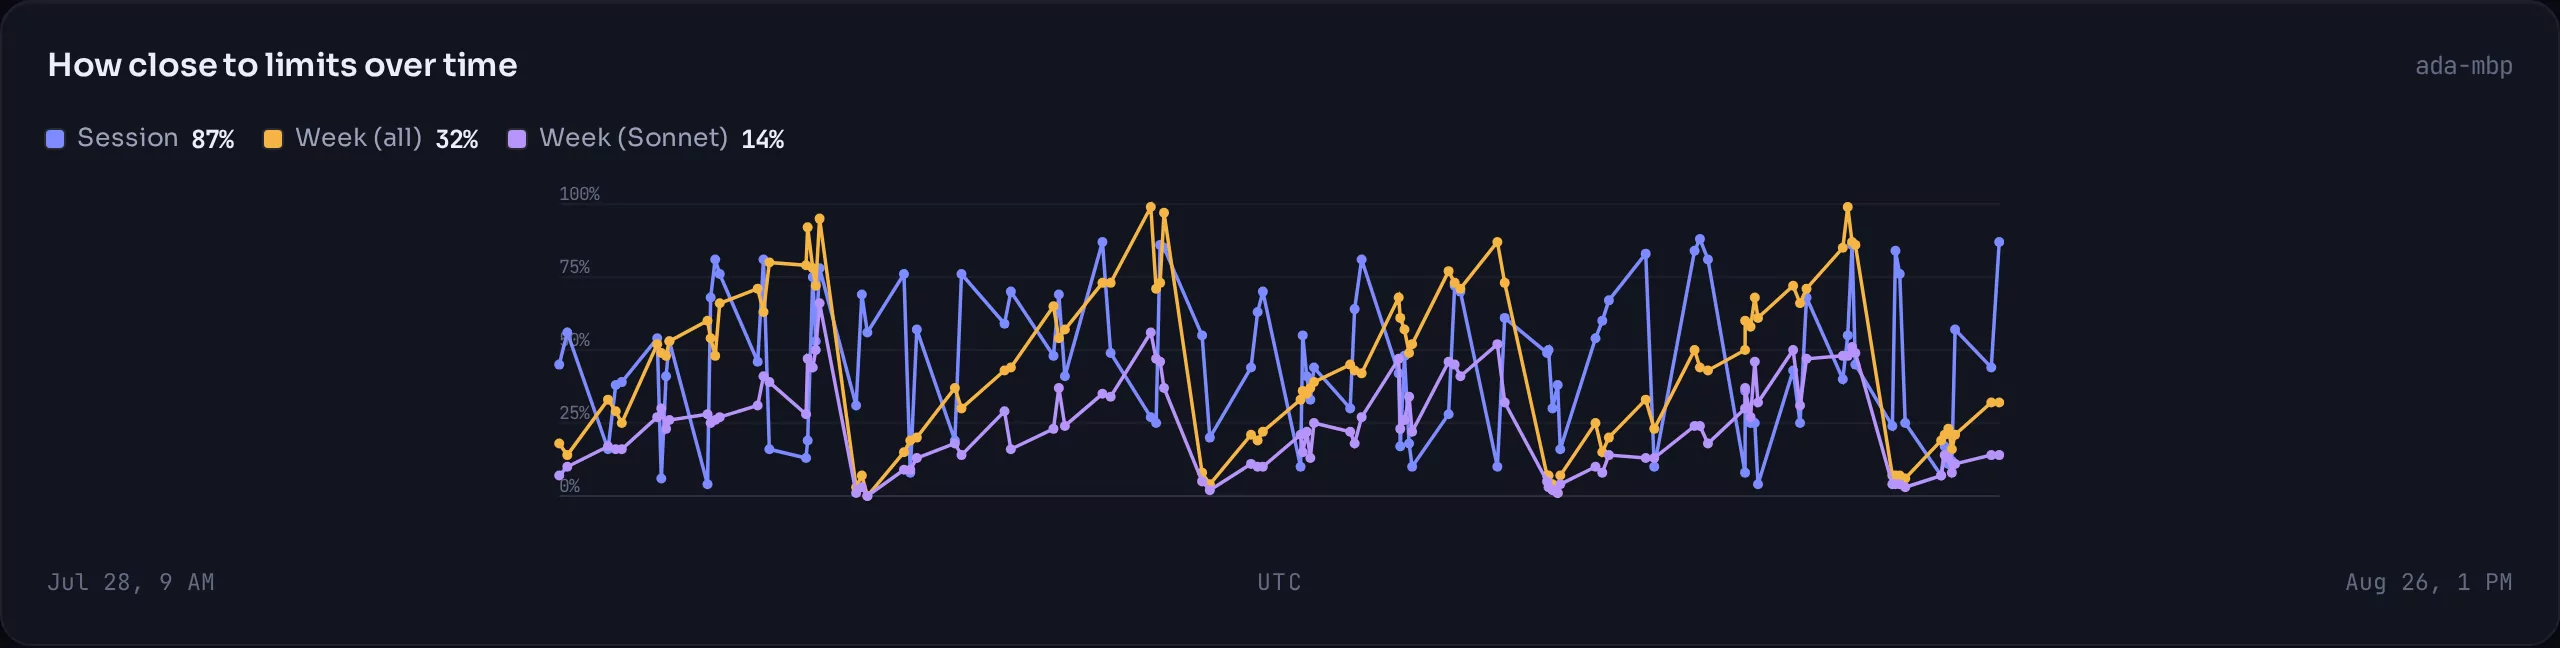
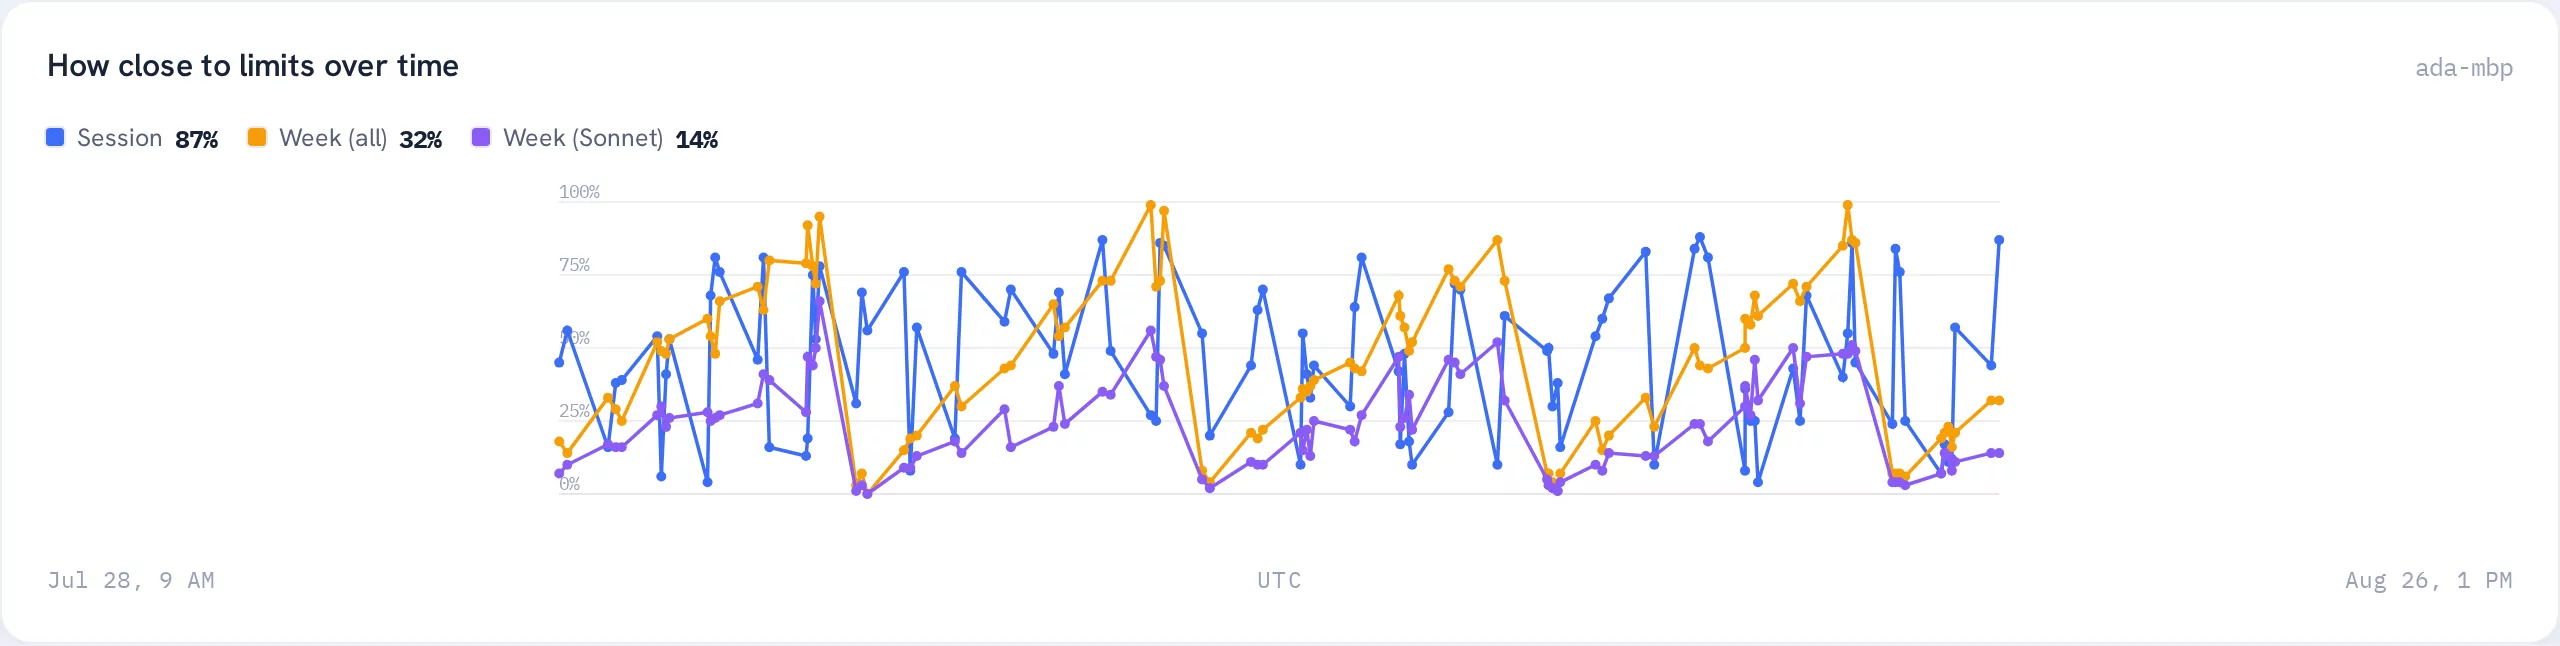
How close you are, and how you got there.
Session, weekly and Sonnet-specific usage against your plan's limits: as gauges for right now, and as a history so you can see whether Thursday is always the problem.
Captured from Claude Code's own /usage readout, so the numbers are the
ones the tool itself would show you.
04 Rhythm
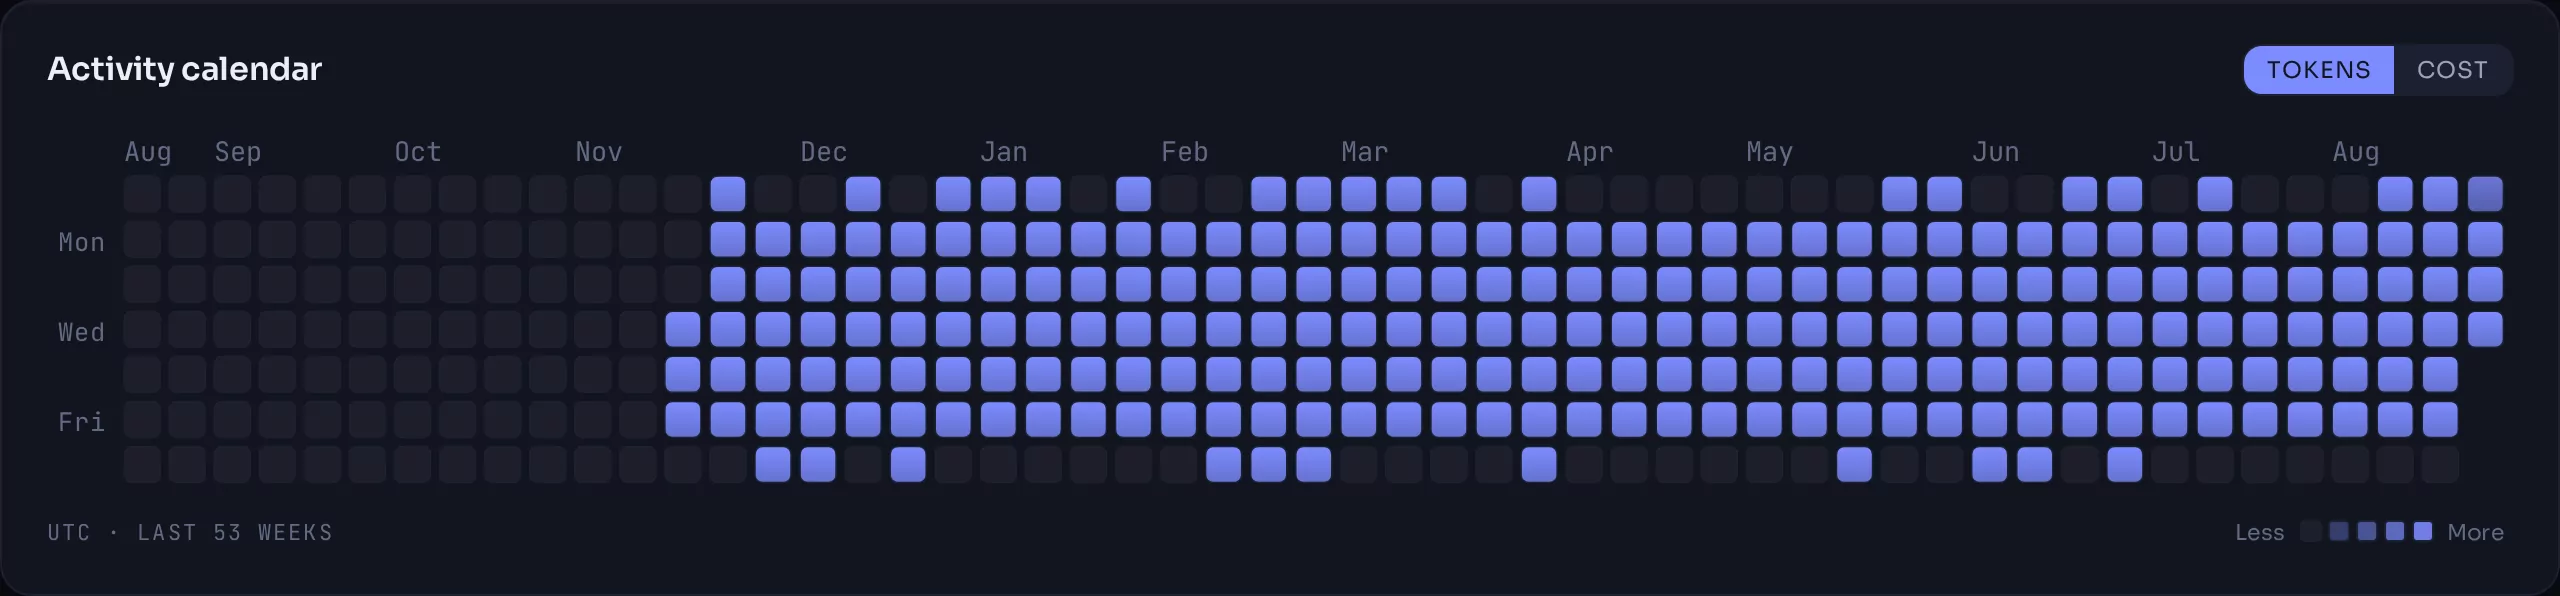
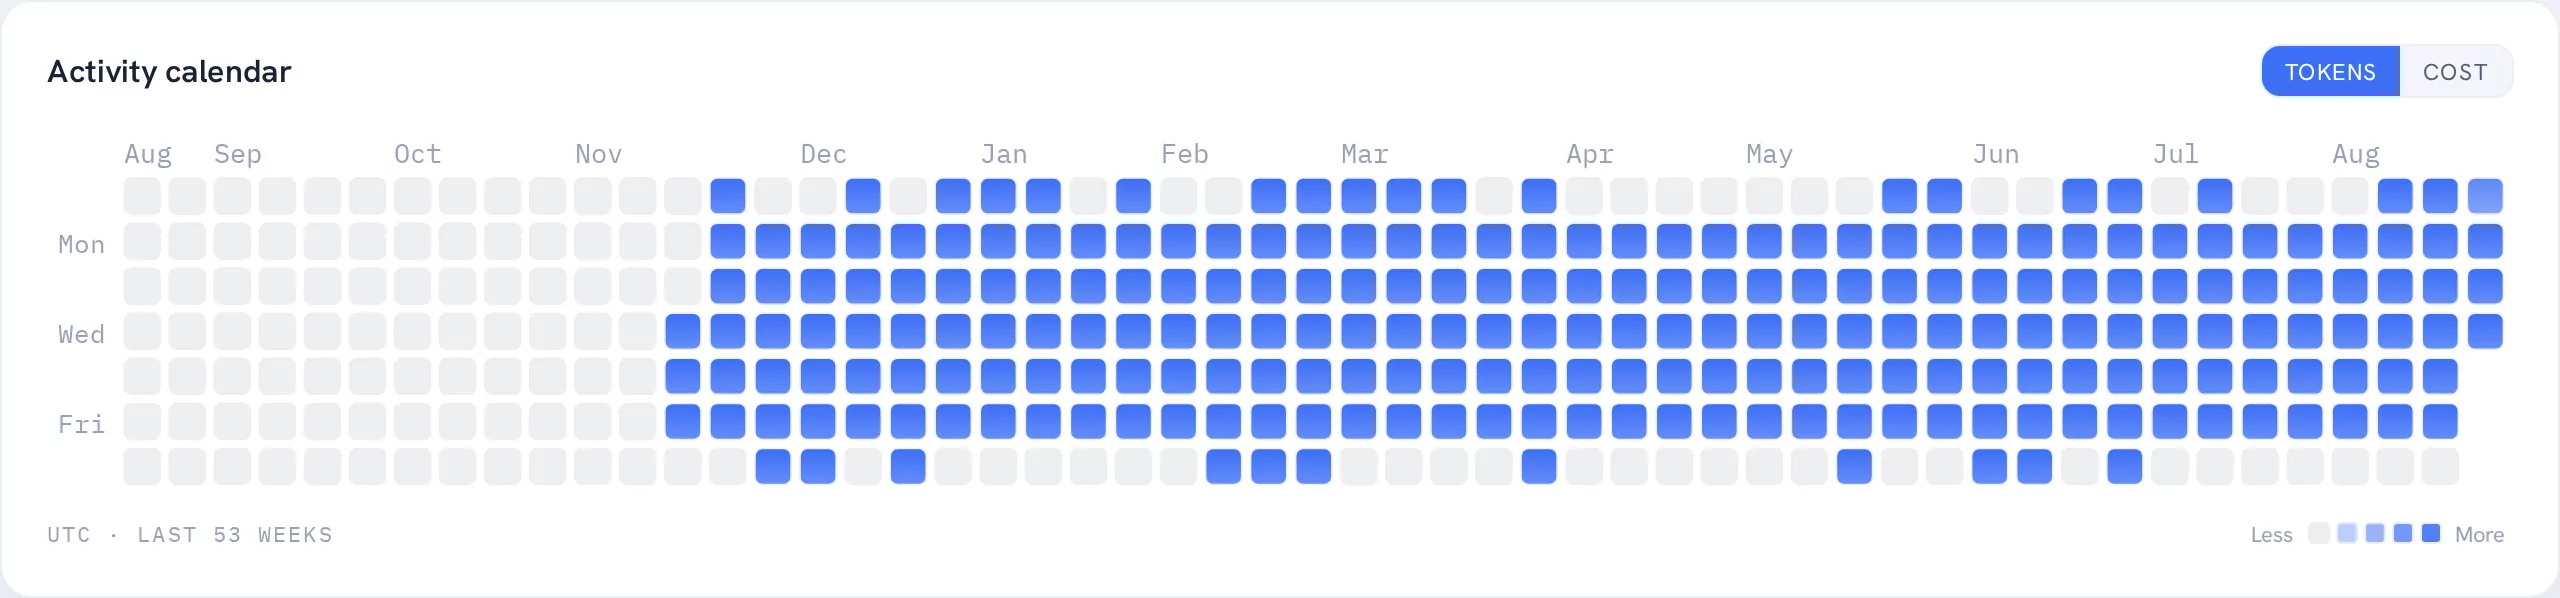
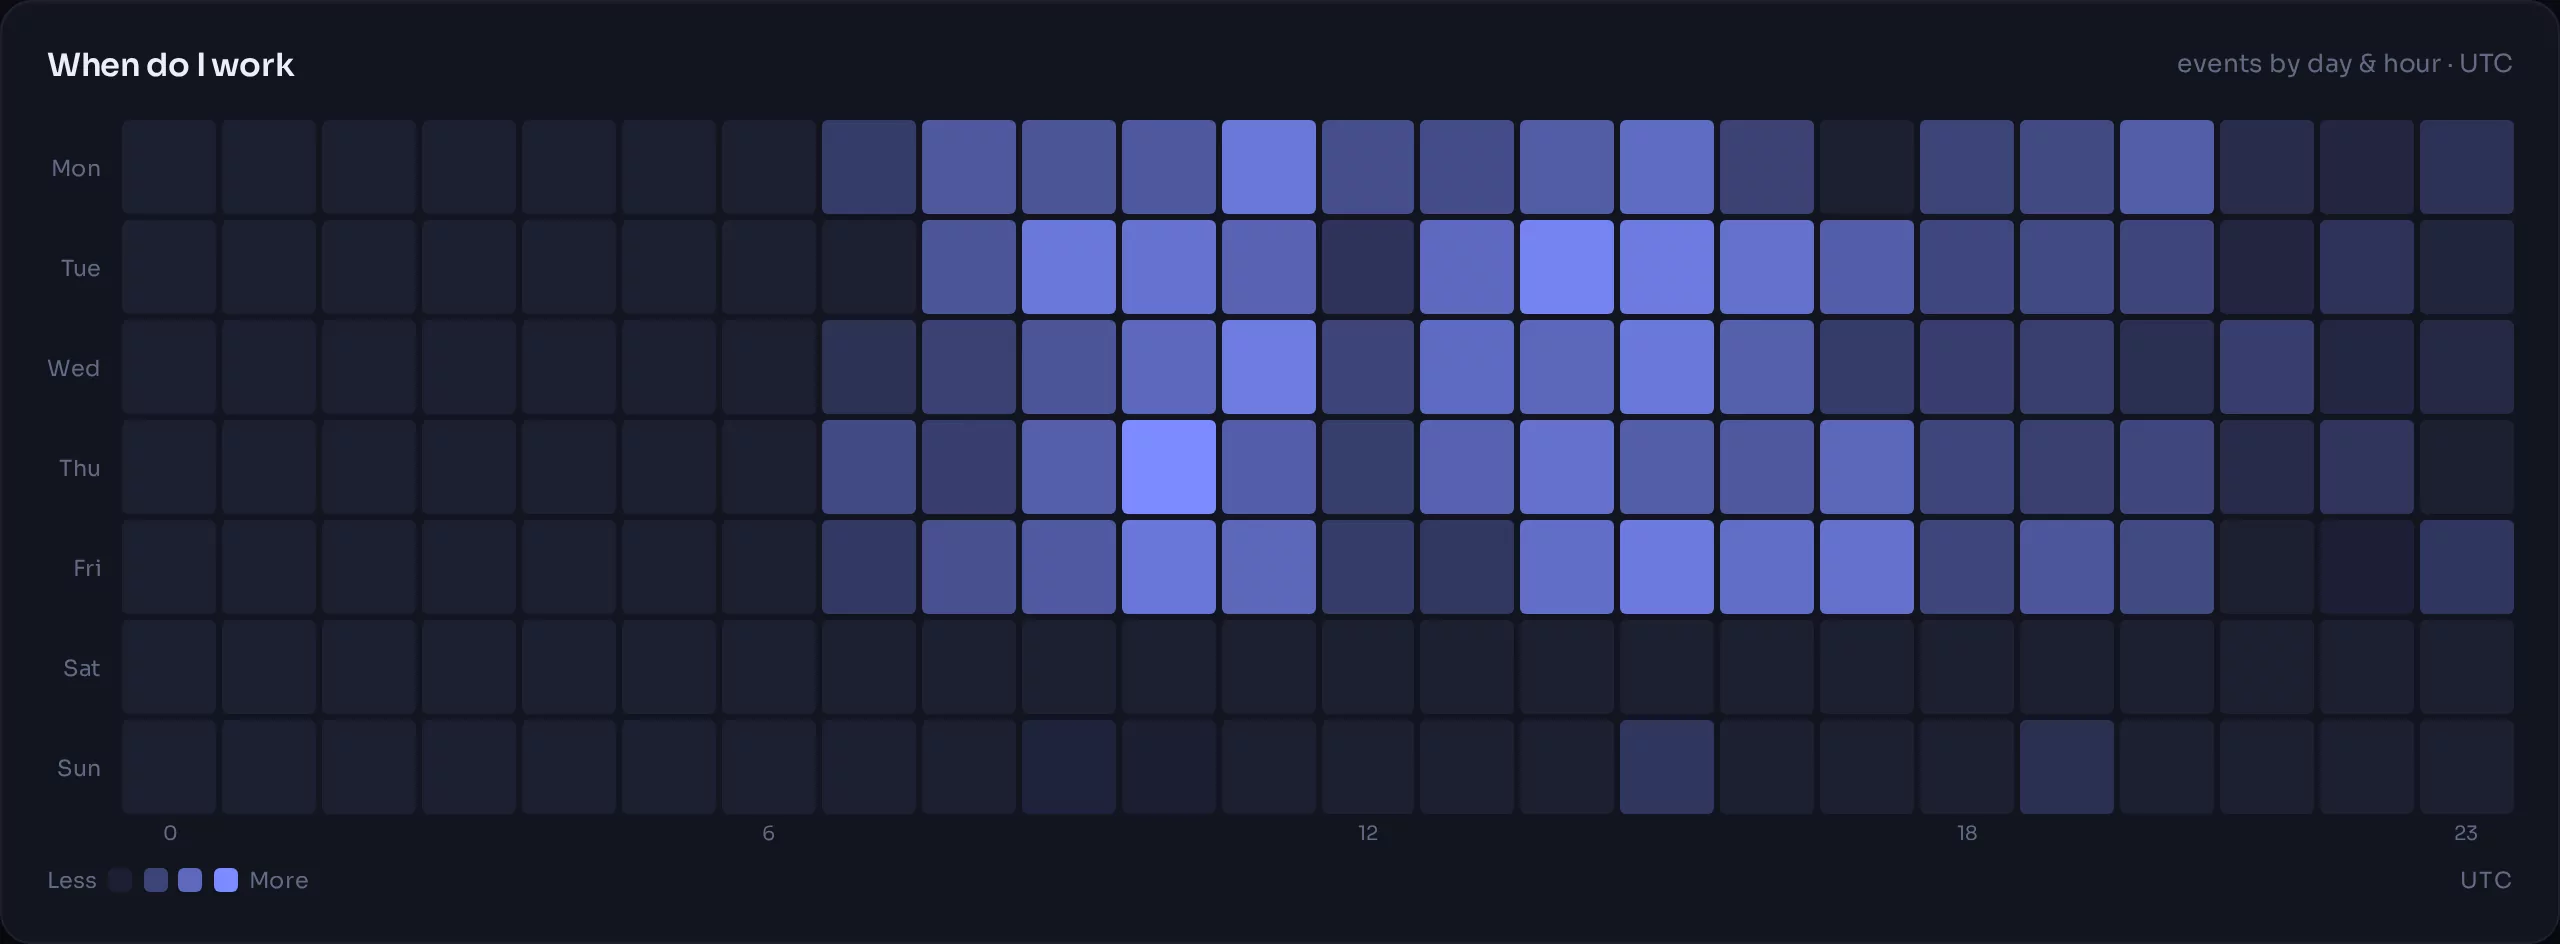
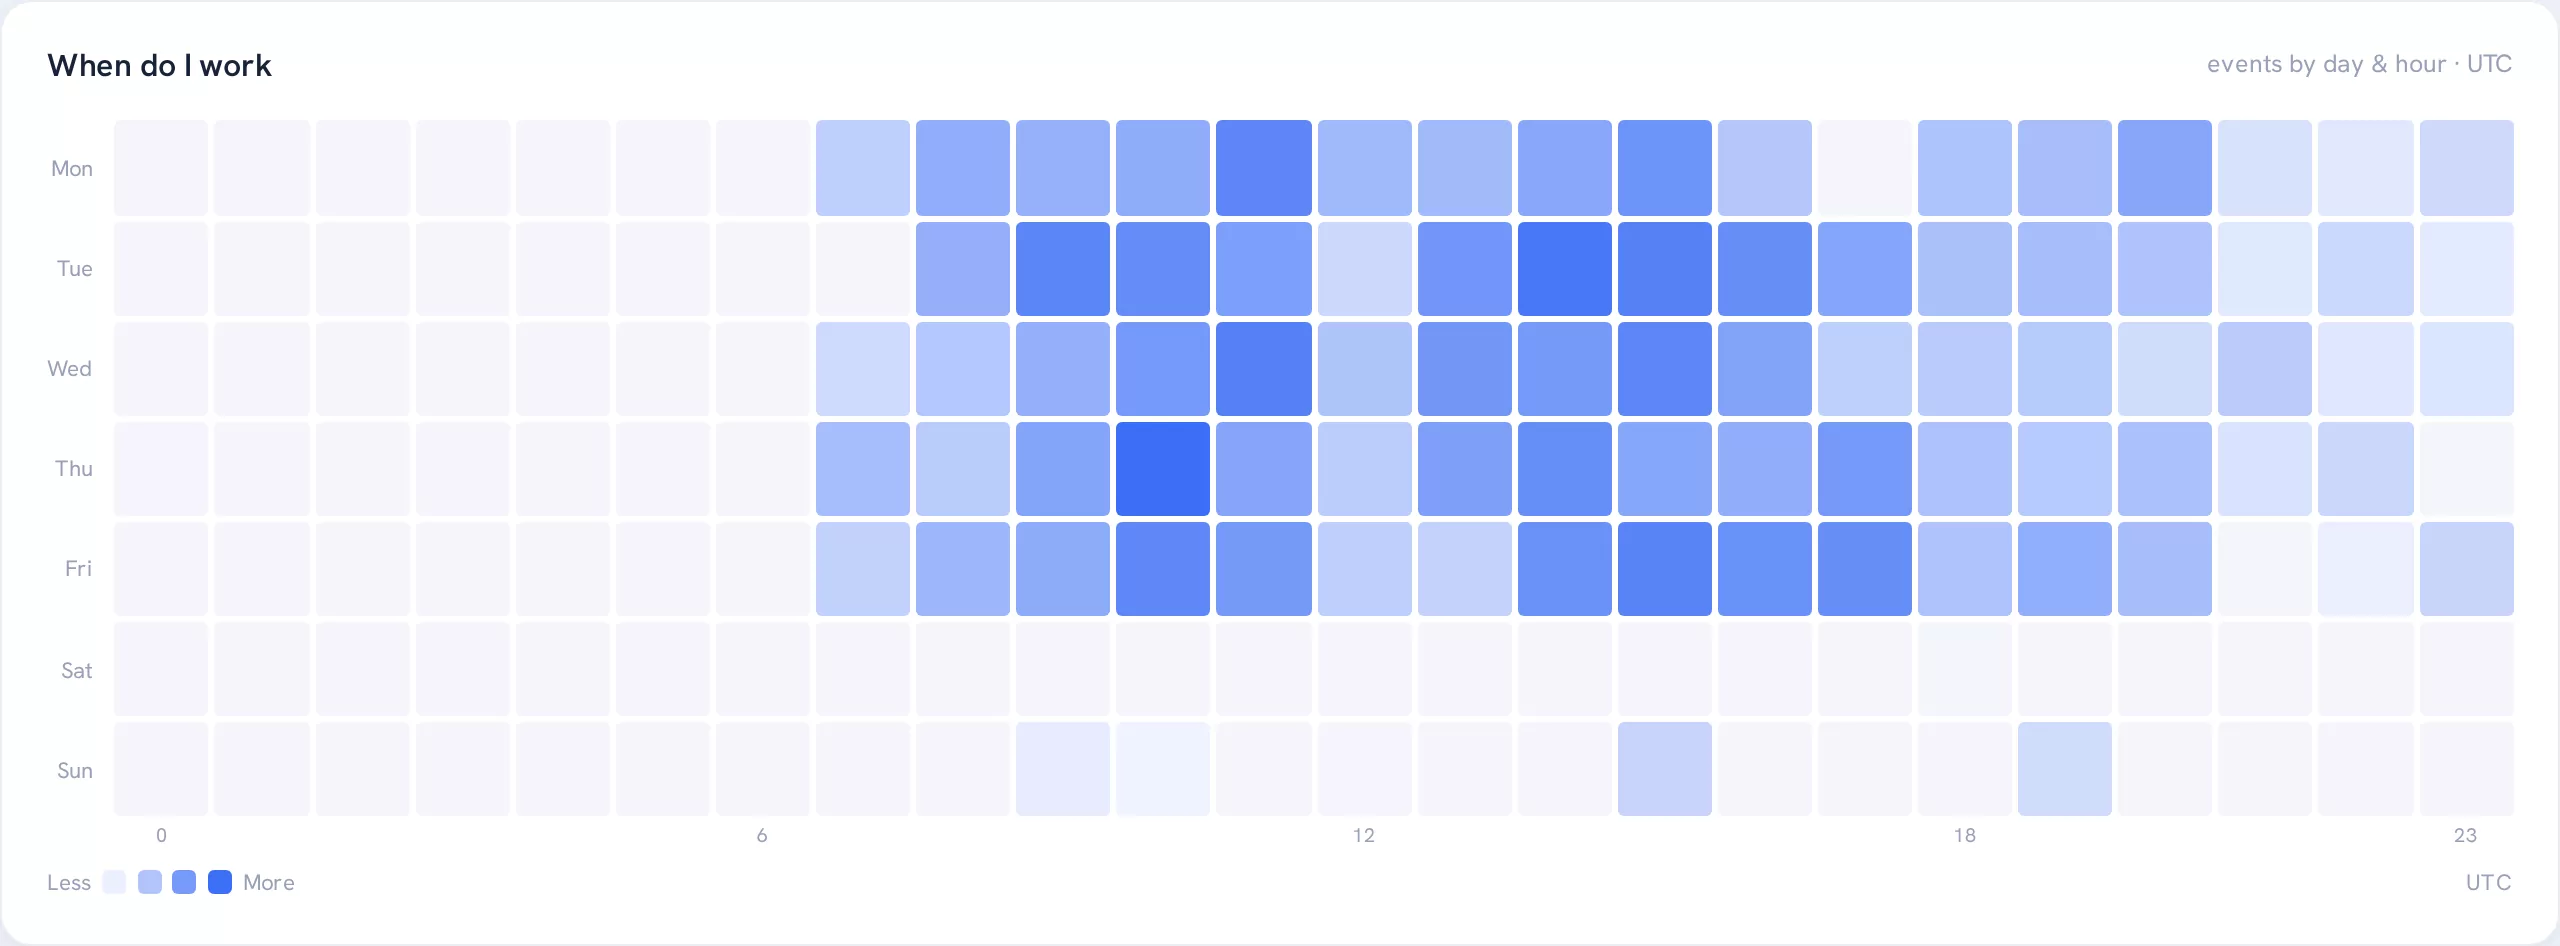
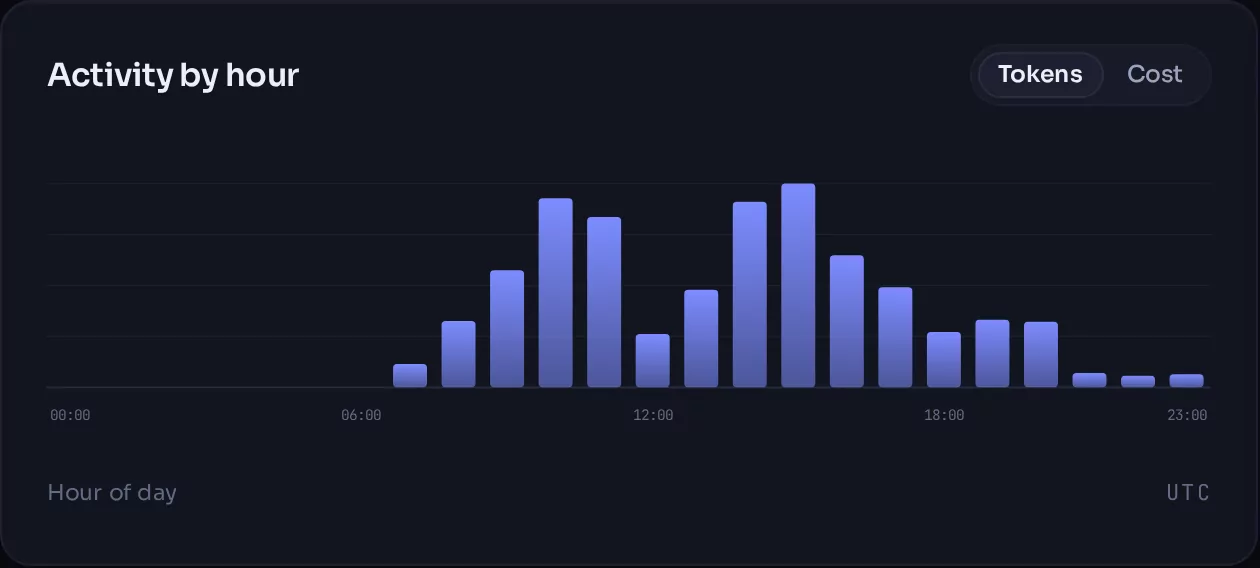
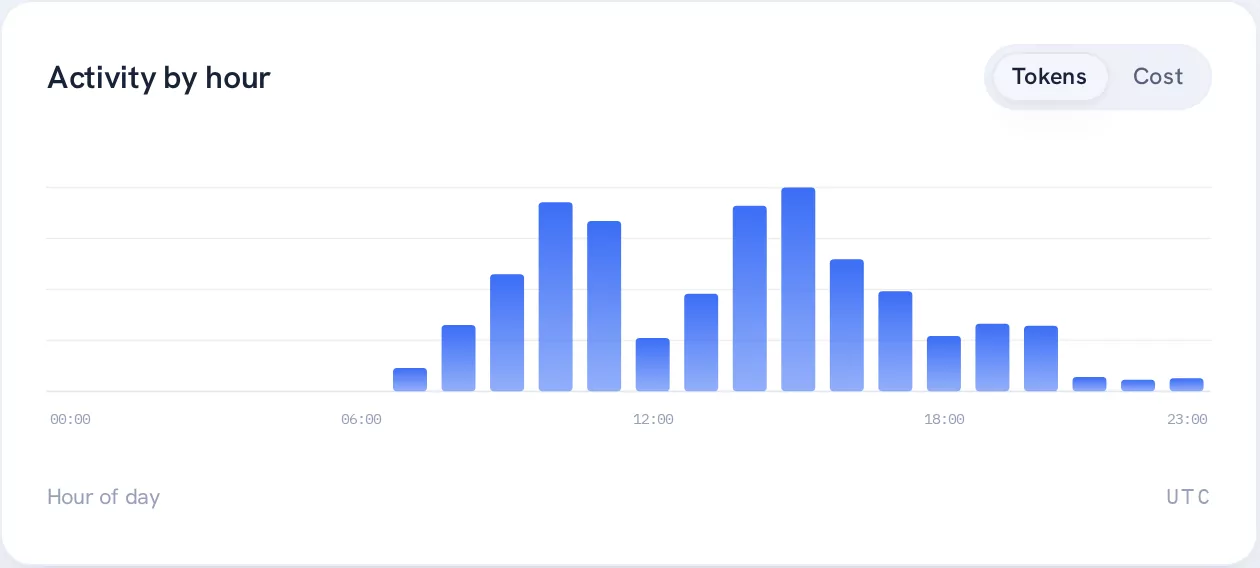
When the work actually happens.
Useful for capacity, and quietly useful for noticing that a "quick experiment" ran every night for three weeks.
05 Sessions
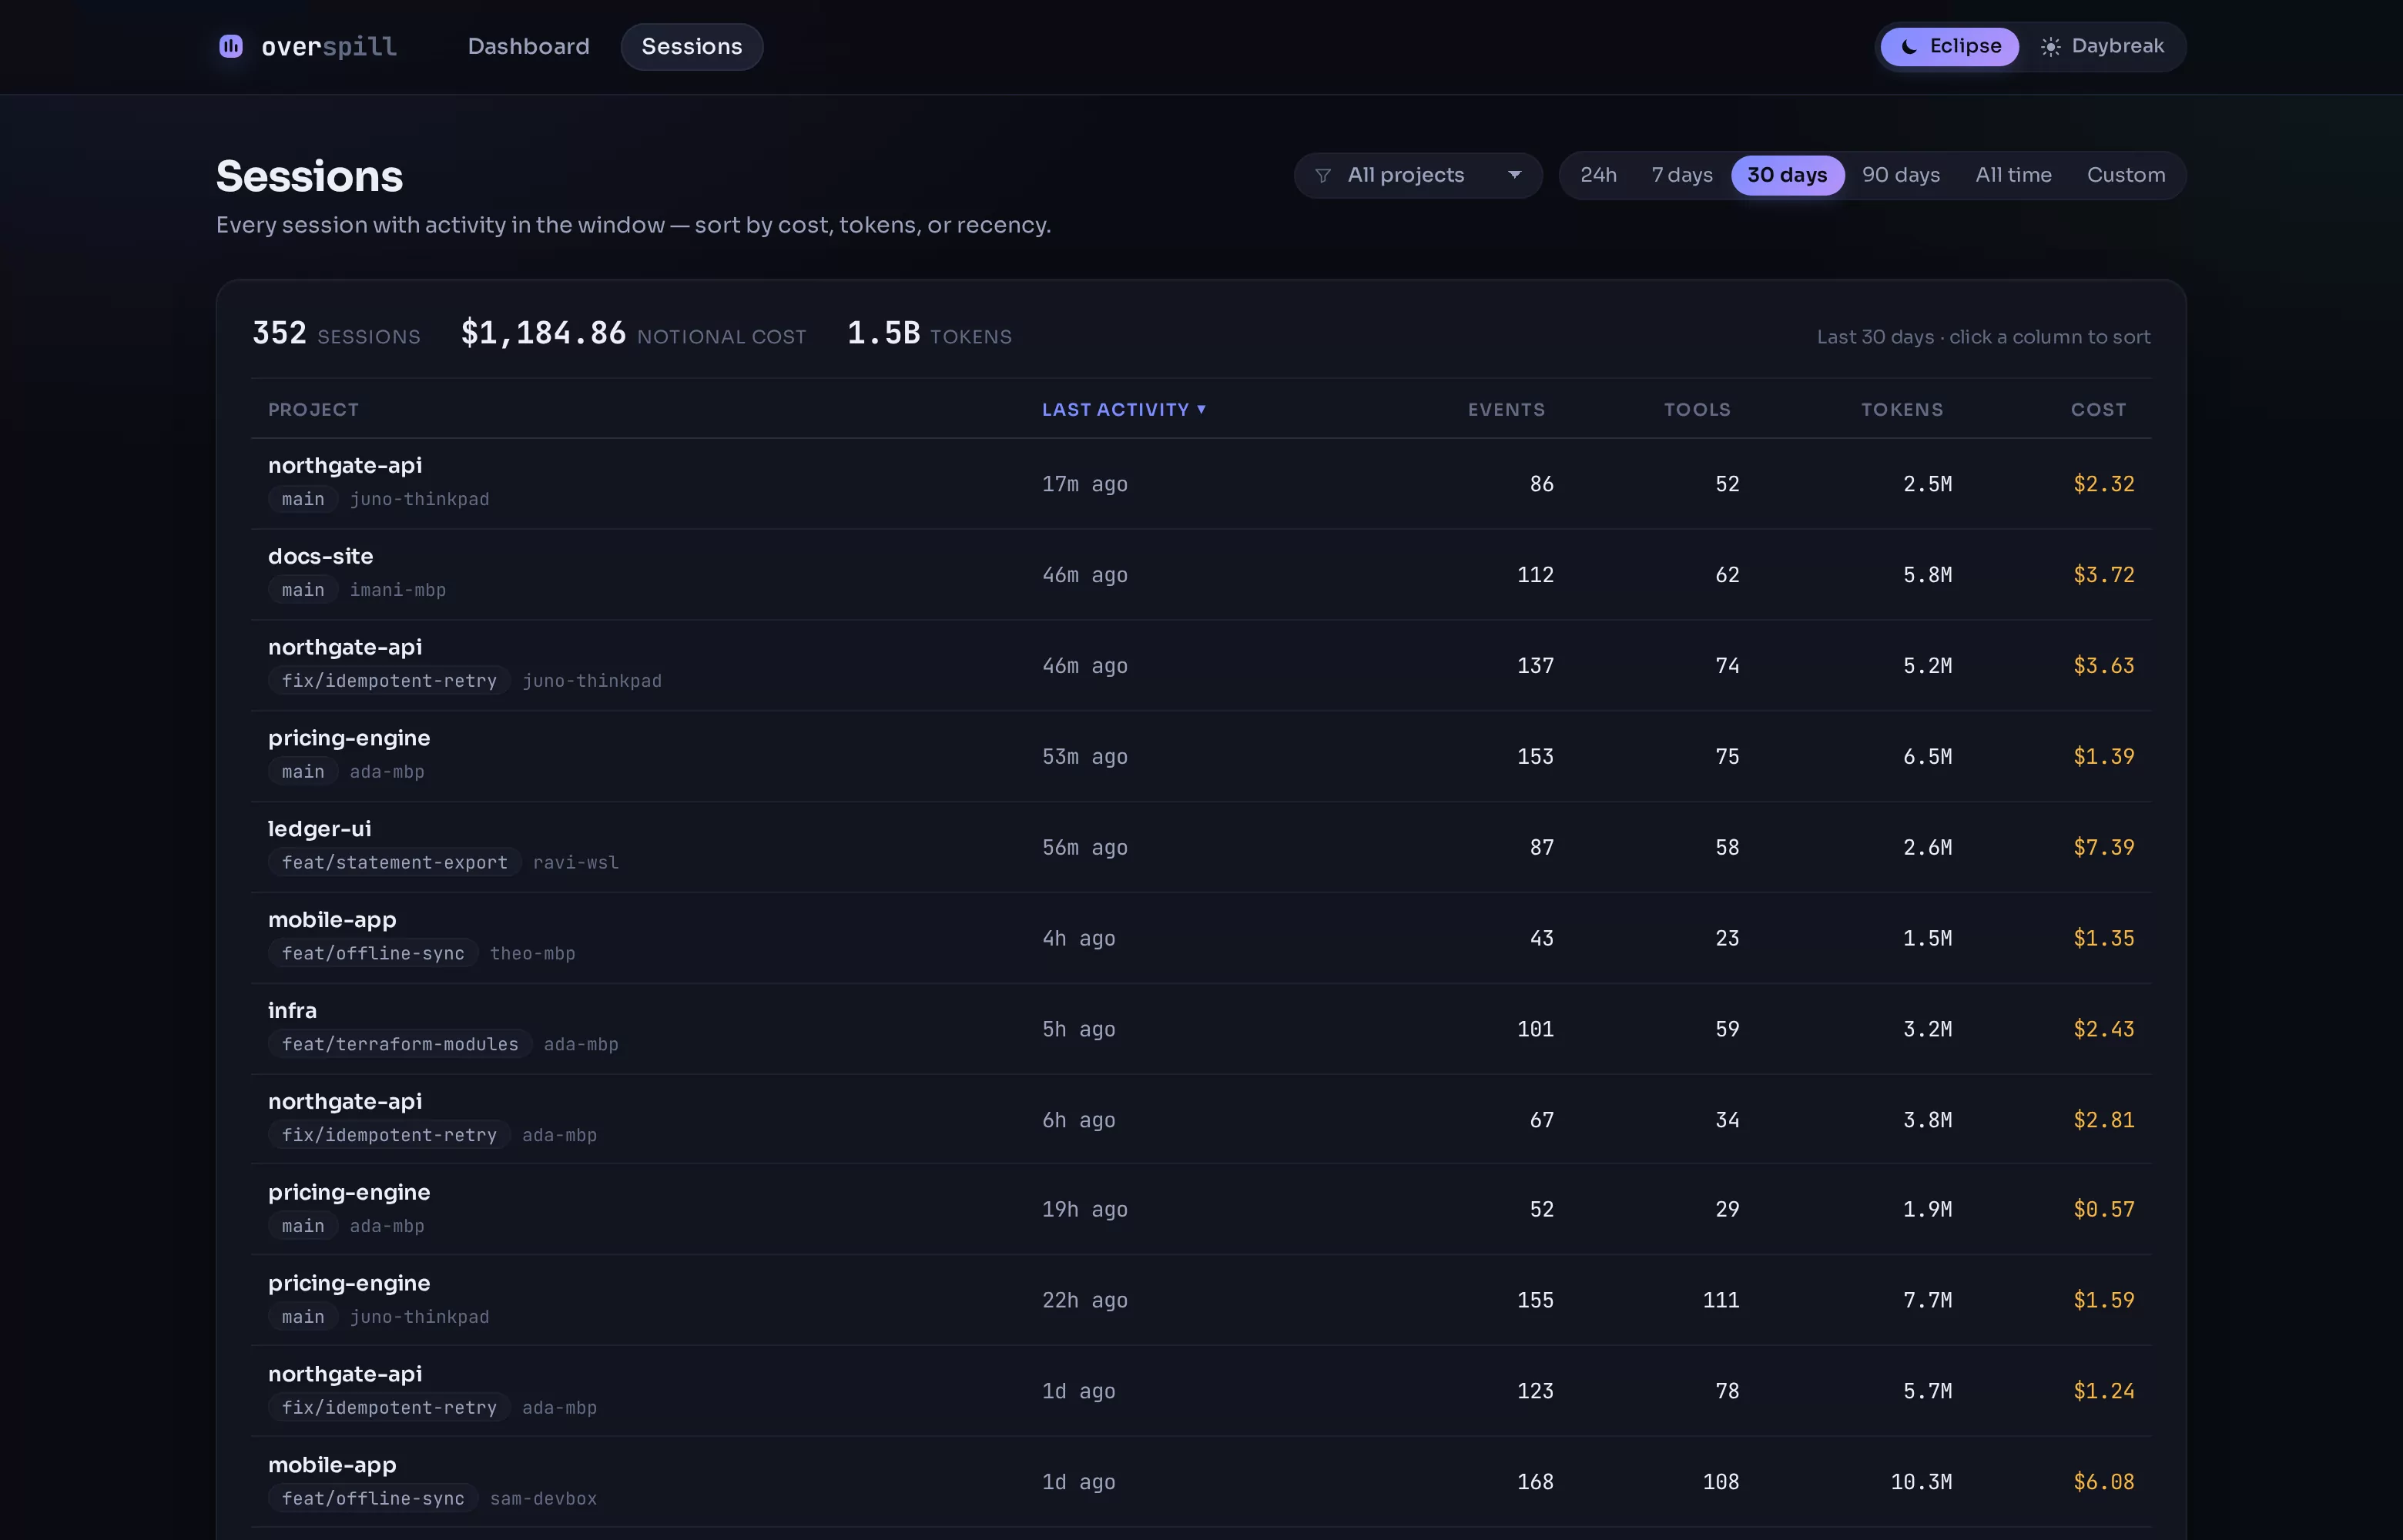
Every session, with the numbers attached.
Project, branch, machine, duration, model, tokens and cost, sortable and filterable, so "which session cost eleven pounds" is a question you can answer.
06 Beyond the dashboard
The parts that are not a chart.
Most of the engineering in this project is in making the numbers trustworthy, not in drawing them.
-
An unpriced model can't hide
A model with no rate card silently costs $0. That is how a whole month of Opus usage once reported as free. Overspill distinguishes priced, genuinely free (a local model) and unknown, and warns about the third in a banner above the headline figure.
-
Streamed turns counted once
A single assistant message arrives as several physical lines, each repeating the running token count. Counting them naively overstates spend: measurably, by a third in one reproduced case. Every group is recomputed from the database, which is the only place that holds all of it.
-
Subagents included
Much of a team's Sonnet and Haiku usage lives in subagent transcripts, not the main session file. Those are read too — a tool that quietly skipped them would under-report the cheap models and flatter the expensive one.
-
A CLI, not a clone
login,backfill,sweep,watch,status,captureandhook install. Installed from npm, Node 20+, no repository to clone and nojq. The hook installer backs your settings up, leaves other hooks alone, and refuses to write at all if the file is unparseable. -
Capture levels, enforced twice
metadataby default,commandsandfullopt-in. The agent will not send what the level forbids and the server will not store it either; the effective level is the lower of the two, so content requires opting in at both ends. -
One database per customer
There is no tenant column anywhere in the schema, and there is not going to be one: the database is the tenant. Self-hosting is simply the single-tenant case of the same code, which is why both editions share one storage layer instead of forking it.
Point it at your own transcripts.
It reads what is already on your disk. Five minutes to a dashboard of your own numbers.